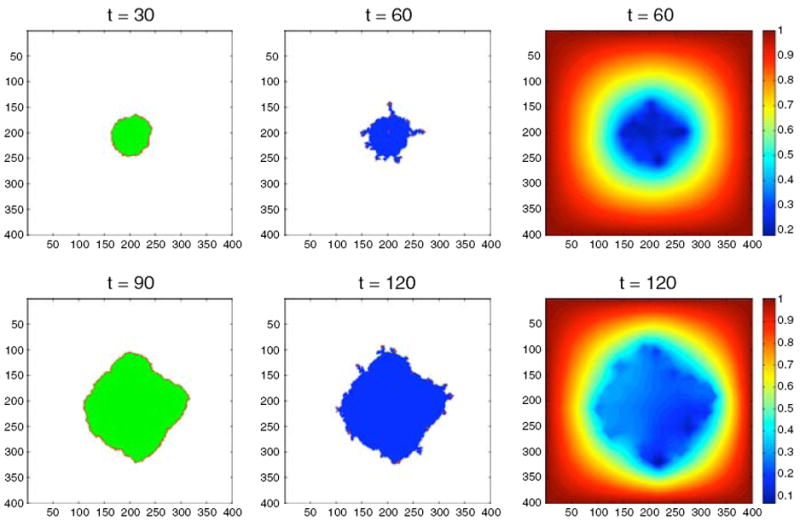
Fig. 11.

The spatial distribution of cells (left and middle columns) and oxygen concentration (right column) for the oxygen switching experiment using the EHCA model. In the high oxygen environment the tumour consists mostly of quiescent cells and grows with a round morphology, while in the low oxygen environment the tumour is dominated by dead cells and we observe a fingering morphology. An accompanying simulation movie is available as ESM
