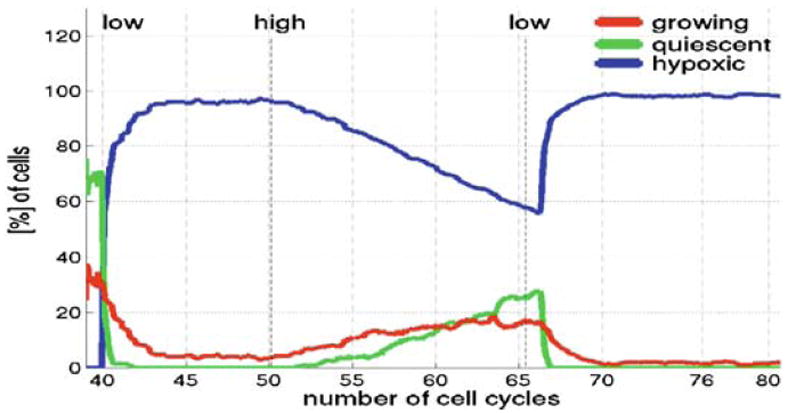
Fig. 15.

Evolution of subpopulations of growing (red), quiescent (green) and hypoxic (blue) cells over the time corresponding to about 40 cell cycles from the simulation shown in Fig. 14. Three vertical lines indicate times of change in the form of nutrients supply
