
Fig. 16.
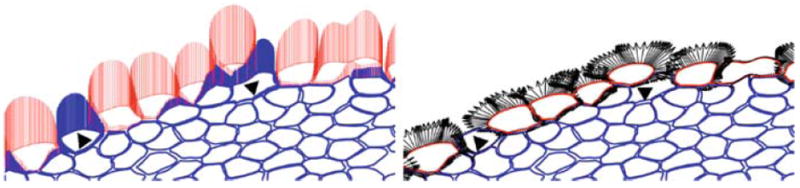
Distribution of cell boundary points used as nutrients-specific membrane receptors in the IBCell model, the magnitude of nutrients concentration sensed by each receptor is shown as vertical lines (left picture); and as growth-specific receptors to sense free space in cell vicinity, directions of cell expansion are shown as arrows (right picture). Hypoxic cells are shown in blue, growing cells in red, one dividing cell (red in the top right corner) is not expanding (right picture), but still senses high concentration of oxygen (left picture)