
Fig. 5.
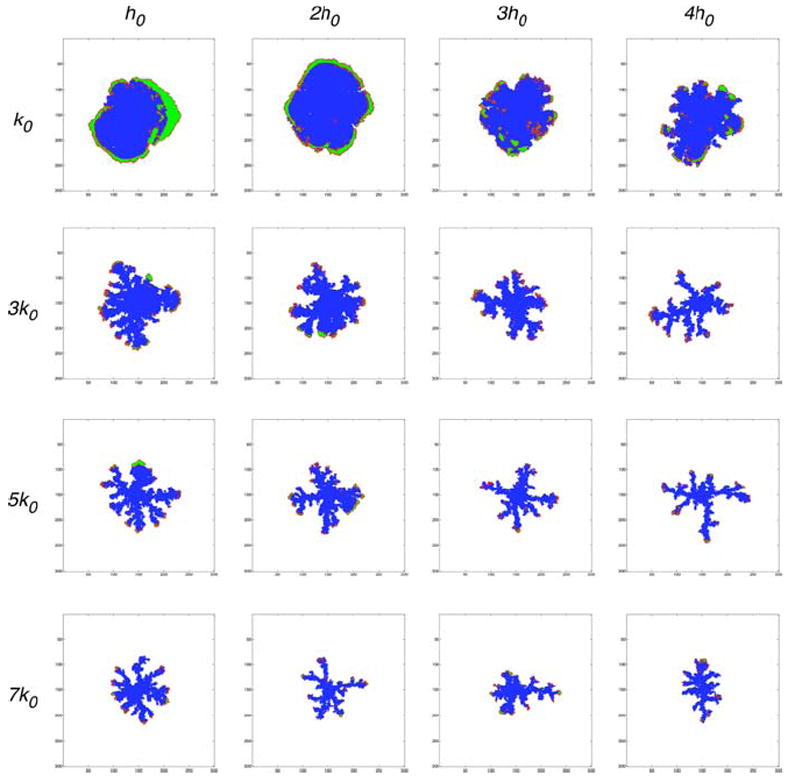
This plot shows the morphology in different regions of the parameter space (k, h) obtained using the EHCA model. Both parameters influence the morphology of the tumour and for high k and h we observe a fingered tumour morphology
Official websites use .gov
A
.gov website belongs to an official
government organization in the United States.
Secure .gov websites use HTTPS
A lock (
) or https:// means you've safely
connected to the .gov website. Share sensitive
information only on official, secure websites.
This plot shows the morphology in different regions of the parameter space (k, h) obtained using the EHCA model. Both parameters influence the morphology of the tumour and for high k and h we observe a fingered tumour morphology