
Fig. 6.
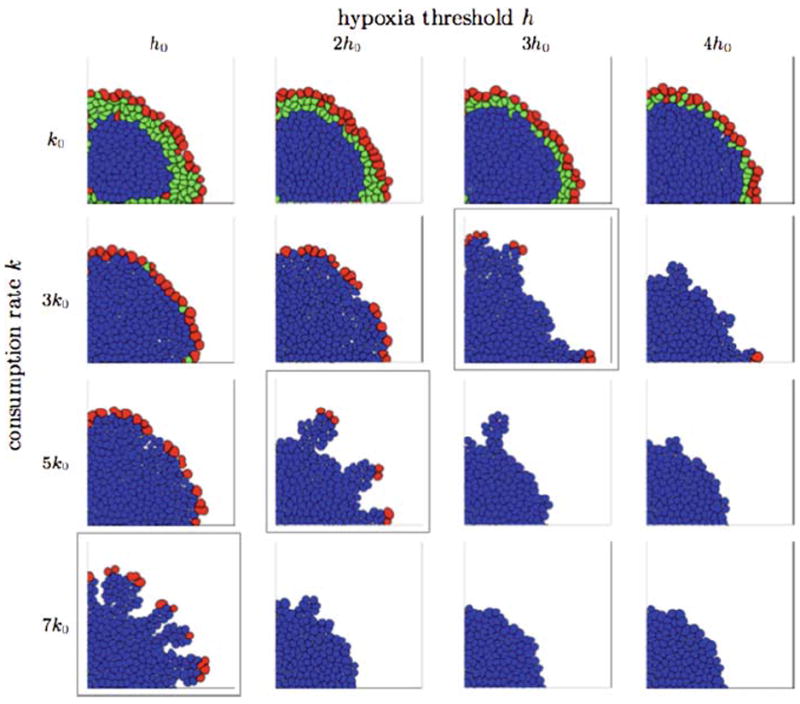
Final tumour configurations from the IBCell model obtained for various consumption rates and hypoxic thresholds, all presented at a time corresponding to 11 average cell cycles from pattern initiation. Three different patterns are observable: finger-like morphology (framed diagonal), continuous growth with smooth tumour boundaries (above the diagonal), and tumour growth suppression due to lack of nutrients (below the diagonal). Cells are colour-coded as follows: red growing; green quiescent; blue hypoxic