
Fig. 7.
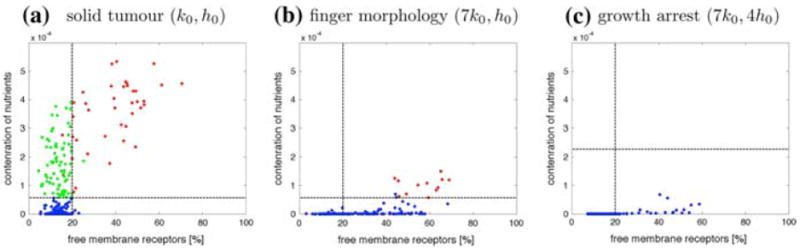
Distribution of all cells according to the concentration of nutrients sensed by each cell and the percentage of free growth receptors in a solid tumours, b tumours with finger-like morphology, c tumours in growth arrest from simulations in Fig. 6. Horizontal lines represent the hypoxic threshold. Vertical lines represent the 20% growth threshold. Cells are colour-coded as follows: red growing; green quiescent; blue hypoxic