
Fig. 8.
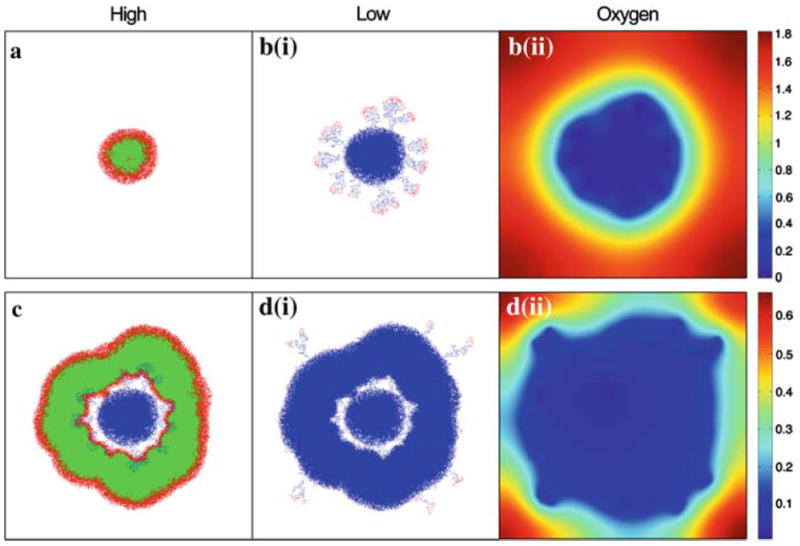
Simulations results from the HDC model showing the tumour cell distributions at the end of each switch in oxygen concentration: a high (t = 60); b (i) low (t = 160); c high (t = 220); d (i) low (t = 320). Colouration represents cell type: red proliferating; green quiescent; blue dead. The oxygen concentration fields are also shown for both the low regimes: b (ii)t = 160 and d (ii)t = 320. An accompanying simulation movie is available as Electronic Supplementary Material (ESM)