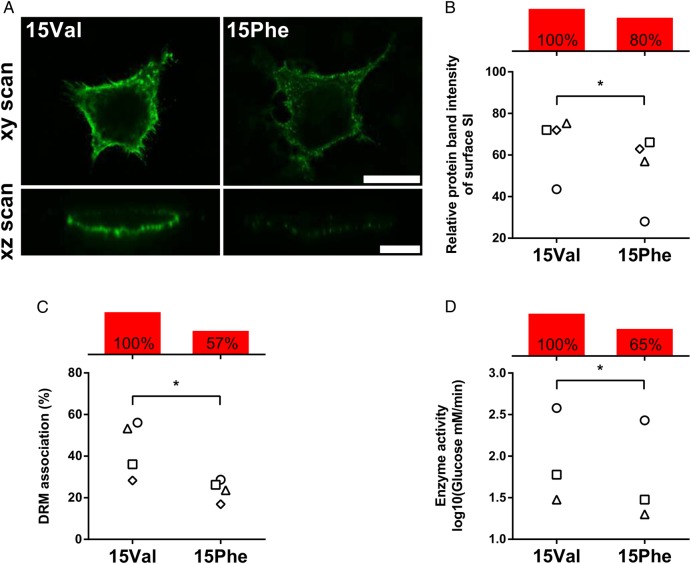
Figure 2.
Functional characterisation of the p.Val15Phe coding polymorphism. COS-1 cells were transiently transfected with either 15Val or 15Phe cDNAs and studied 48 hours after transfection. Individual values for 15Val and 15Phe cells from the same experiment are indicated with identical symbols. Net differences are reported with red bars as per cent average relative to 15Val arbitrarily set as 100% reference. (A) Cell surface localisation via immunofluorescence. Non-permeabilised cells were immunostained with a mixture of anti-sucrase–isomaltase (SI) antibodies and Alexa 488 secondary antibody, and analysed by confocal laser scanning microscopy on the xy (scale bar 25 µm) and xz planes (scale bar 10 µm). (B) Quantification of cell surface expression. SI surface proteins were labelled with biotin and immunoprecipitated using anti-Si antibodies after cell lysis. Immunoprecipitates were divided into two equal aliquots and analysed by immunoblotting with either anti-SI or anti-streptavidin antibodies. Relative quantification of surface-bound SI versus total cell SI was performed, and results are expressed in relation to values obtained for 15Val, which is set to 100%. (C) Quantification of association with sphingolipid/cholesterol-rich microdomains (lipid rafts) via detergent-resistant membrane (DRM) analysis. Following non-ionic detergent cell lysis, SI proteins were immunoprecipitated, fractionated by ultracentrifugation into insoluble (pellet, raft) and soluble (supernatant, non-raft) fractions, and DRM association (raft) quantified by immunoblotting with anti-SI antibodies. (D) Quantification of enzymatic activity. Sucrase activity was determined on immunoprecipitated SI proteins by measuring glucose release with the GOD–PAP method, upon normalisation for total protein amount by immunoblotting. *p<0.05.

