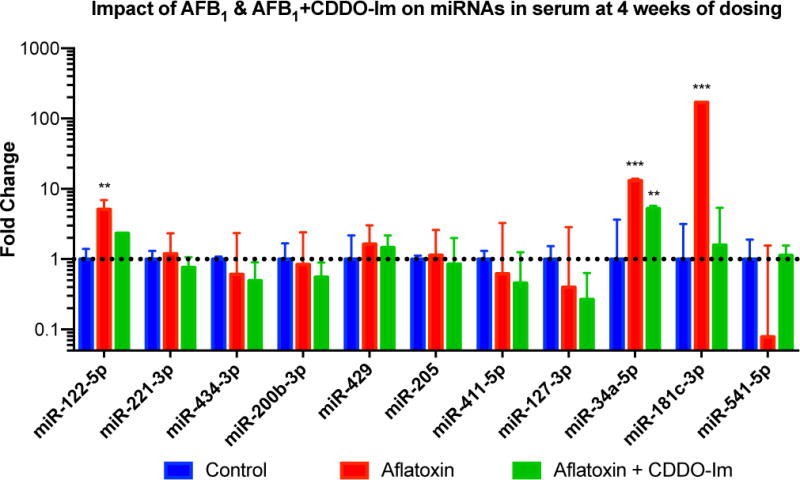
Figure 5.

Real-time PCR analysis of candidate miRNAs in serum after 4 weeks of dosing (mean ± SD). Fold change calculated using the 2−ΔΔCt method. Large variability in rno-miR-541 expression in aflatoxin group due to an animal outlier. (*) indicates significant difference (p<0.05) when compared to control for that miR, (**) indicates significant difference (p<0.01) when compared to control for that miR, (***) indicates significant difference (p<0.001) when compared to control for that miR.
