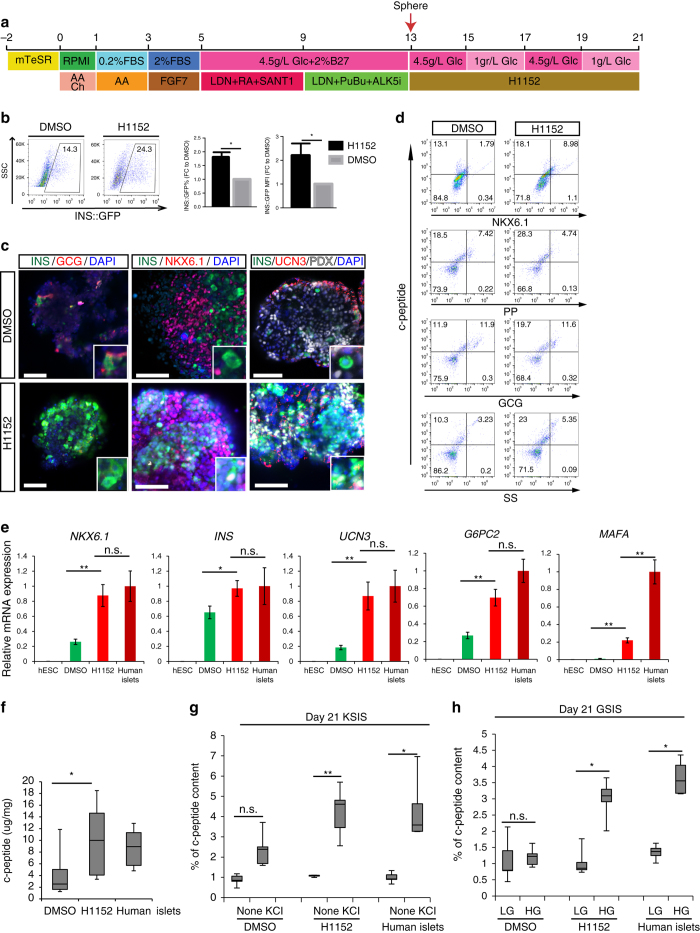
Fig. 2.
H1152 promotes the maturation of hESC-derived glucose-responding cells. a Scheme of the directed differentiation protocol. b Flow cytometry analysis, the percentage of INS-GFP+ cells and the mean signal of INS-GFP+ cells of DMSO and H1152 treated spheres. c–e Confocal imaging (c) intracellular FCM (d) and qRT-PCR (e) analysis of H1152-treated or DMSO-treated spheres. N = 3–6 independent biological replicates. Scale bar = 25 μm. Error bar is SEM. Primary human islets were used as a control in Fig. 2e. UCN3: urocortin3, SS: somatostatin, PP: pancreatic polypeptide. f Total c-peptide content of H1152-treated or DMSO-treated spheres, compared with human islets. g KCl-stimulated insulin secretion of H1152-treated or DMSO-treated spheres. h GSIS of H1152-treated or DMSO-treated spheres. N = 8–12 independent biological replicates. n.s. indicates non-significant difference. p-values were calculated by unpaired two-tailed Student’s t-test. *p < 0.05, **p < 0.01. AA Activin A; Ch Chir; Glc Glucose; RA Retinoic acid; KSIS KCl stimulated insulin secretion; GSIS Glucose stimulated insulin secretion. The bottom and top of the box represent the first and third quartiles, the band inside the box represents the median. The ends of the whiskers represent the minimum and maximum of all the data

