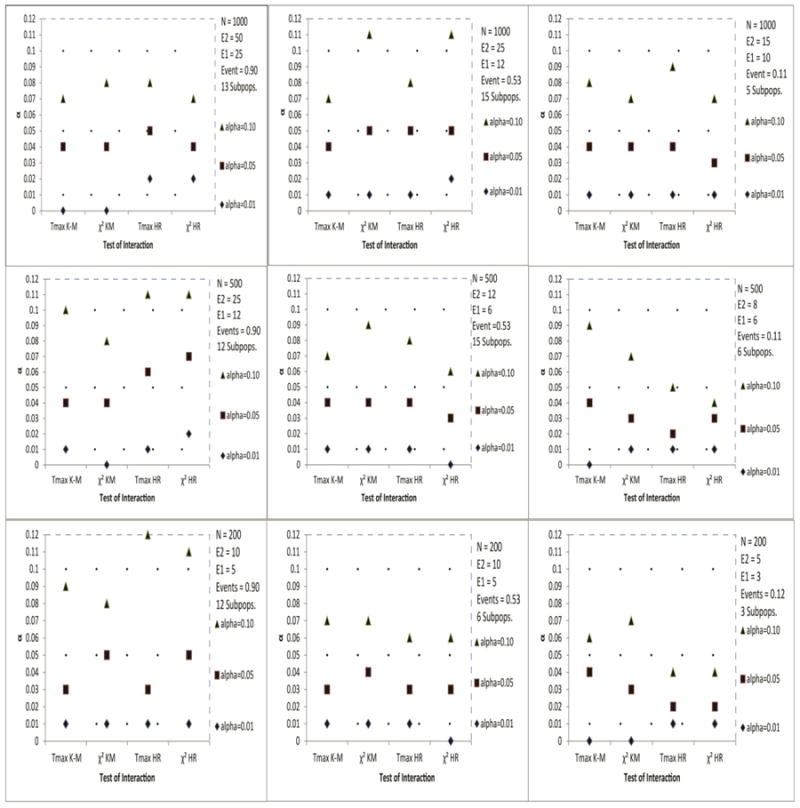
Figure 1.

Estimated α level of the test for interaction based on the Tmax and statistics of STEPP survival endpoints: Kaplan-Meier (K-M) and Hazard Ratio (HRO-E) based on O − E estimation.
The 99% interval for permutation probability value 0.01, 0.05 and 0.10 are (0.00, 0.02), (0.04, 0.06) and (0.08, 0.12), respectively.
Events represents the average proportion of observed events.
Subpops. represents the average number of subpopulations.
The results were based on 300 simulations of sample size N.
