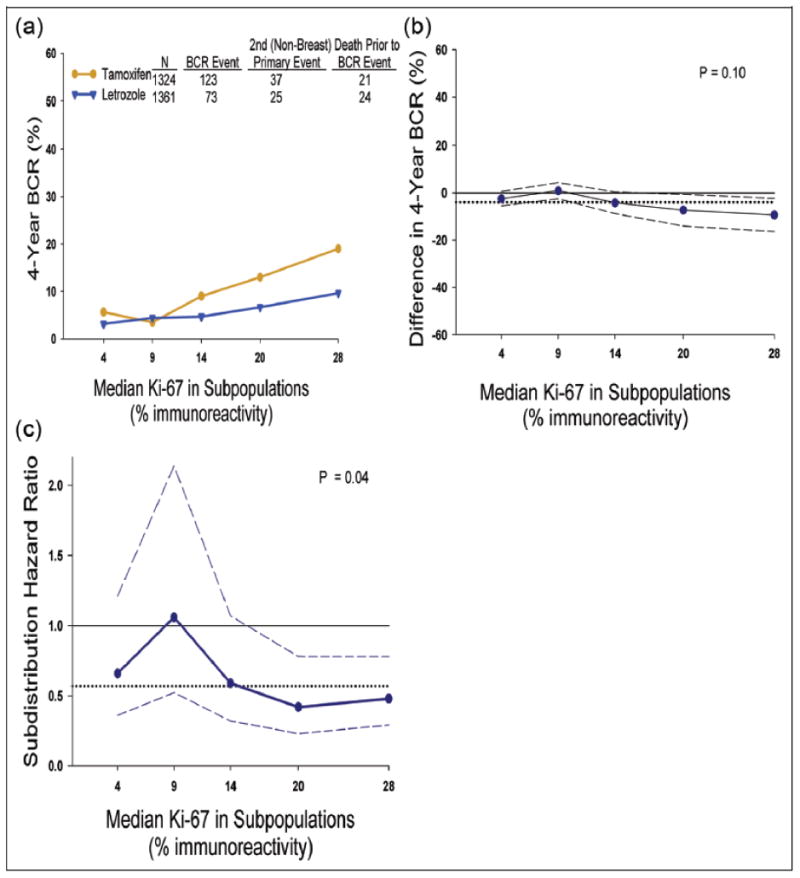
Figure 4.

Subpopulation treatment effect pattern plot analysis of the treatment effect of letrozole vs. tamoxifen as measured by: (A) 4-year cumulative incidence of breast cancer recurrence (BCR), (B) difference in 4-year cumulative incidence of BCR (letrozole minus tamoxifen, less than zero suggested letrozole better, otherwise tamoxifen better), and (C) subdistribution hazard ratio (letrozole v tamoxifen; less than one suggested letrozole better; otherwise tamoxifen better) with corresponding point-wise 95% confidence intervals (dashed lines). The x-axes indicate median percentage of Ki-67 for patients in each of the overlapping subpopulations. To construct the overlapping subpopulations, we set e2 = 15 events as the number of events of each subpopulation in each treatment group, thus totaling at least 30 events within each subpopulation, and e1 = 5 as the number of events within consecutive overlapping subpopulations within each treatment group, thus totaling a maximum of 10 overlapping events. Solid grey line indicates no effect, and black dotted line indicates overall effect.
