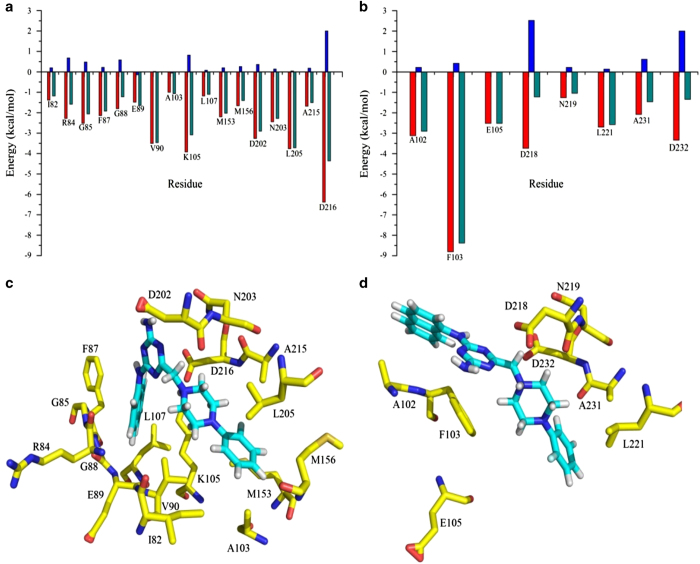
Figure 2.
Contributions of the important residues for binding of FPND with (a) ROCK1 and (b) ROCK2; the red columns represent the non-polar contributions, the blue columns represent the polar contributions and the green columns represent the total energy of each residue. The structures of (c) the ROCK1/FPND complex and (d) the ROCK2/FPND complex; the carbon atoms of FPND are colored in cyan and the carbon atoms of the key residues are colored in yellow.

