FIG 2.
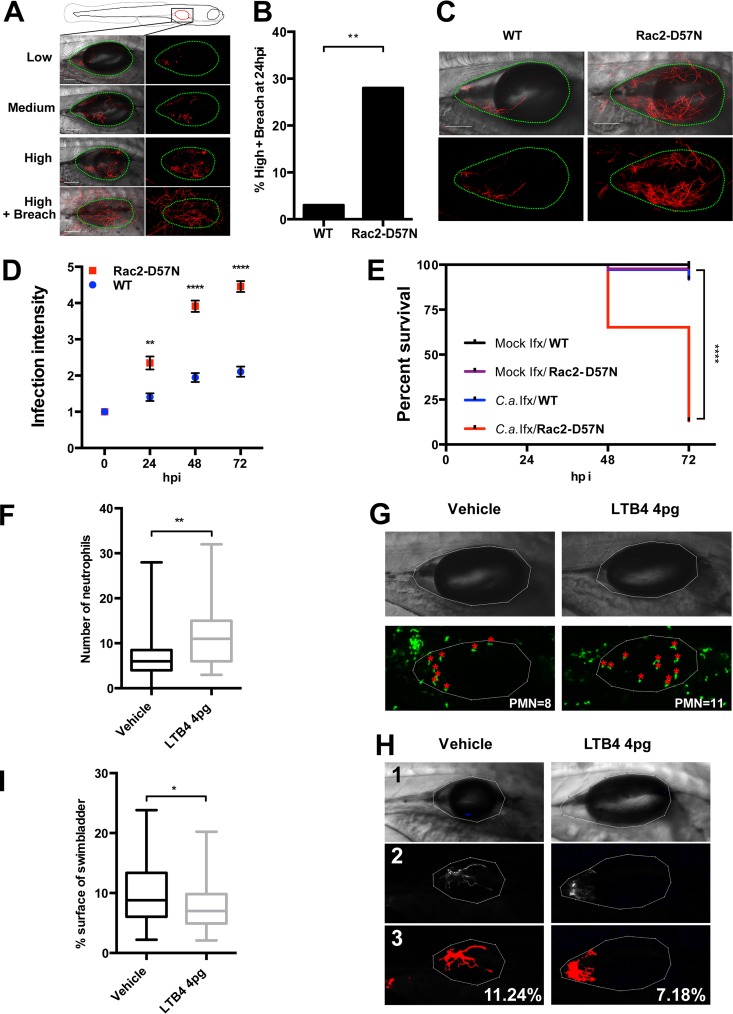
Up- or downmodulation of neutrophil recruitment impacts disease progression. At 4 dpf, mpo:Rac2-D57N and WT sibling (A to E) or mpx:GFP (F to I) larvae were injected into the swim bladder with 4 nl of Caf2-dTom yeast cells (107 CFU/ml in 5% PVP) or with PVP only. Fish were immediately screened, and only fish with 15 to 30 yeast cells were selected. Fish were imaged by confocal microscopy at 24 hpi (A to C) and at 2 and 3 days postinfection (D). (A to D) Blockade of neutrophil recruitment accelerates disease progression. (A) Representative images of the different infection levels (low, less than 20 filaments; medium, 20 to 50 filaments; high, over 50 filaments; and high plus breach, high infection level with filaments breaching the epithelial barrier). The swim bladder is outlined with green dots. Images are maximum projections in the red channel overlaid with a single slice in differential interference contrast. Bars, 100 μm. (B) Percentage of fish with high-plus-breach status at 24 hpi. Pooled percentages and the results of the Fisher exact test are represented (P = 0.0024). (C) Representative images of mpo:Rac2-D57N and WT fish at 24 hpi, as described in the legend to panel A. (D) Fish were longitudinally followed and scored for pathology (on a scale of 1 to 5) as described in Materials and Methods. Infection dynamics are represented by the average pathology score (mean and SEM), and the differences between infected WT and mpo:Rac2-D57N fish were analyzed by the Mann-Whitney test (P = 0.002, 24 hpi; P < 0.0001, 48 hpi; P < 0.0001, 72 hpi). (E) Survival curve of mock- or Caf2-dTom-infected fish over 72 hpi. In panels B, D, and E, data from three independent experiments were pooled (n = 43, 43, 37, and 46 for the four groups indicated from top to bottom, respectively, in the key to panel E). Data were analyzed for statistically significant differences by log-rank (Mantel-Cox) tests (P < 0.0001). (F to I) Artificial neutrophil recruitment reduces disease progression. mpx:GFP fish were coinjected with Caf2-dTom and 4 pg of LTB4 or vehicle. The number of neutrophils in the swim bladder at 24 hpi was counted by confocal microscopy. (F) Number of neutrophils recruited to the swim bladder at 24 hpi. (G) Representative images of infected fish with enhanced green fluorescent protein (EGFP)-expressing neutrophils in the swim bladder lumen (red asterisks) and outline of the swim bladder (in white). PMN, polymorphonuclear leukocytes. (H) Representative images of infected fish to illustrate the process used for quantification of fungal burden. Panels 1, outline of the swim bladder; panels 2, thresholding of C. albicans; panels 3, measurement of the percentage of the swim bladder surface covered by fungal cells. (I) C. albicans burden at 24 hpi by surface coverage of the swim bladder. Data were analyzed with ImageJ software. For panels F to I, data from three independent experiments were pooled (n = 33 and 39 for the vehicle-treated and 4 pg LTB4-treated fish, respectively). Medians, boxes, and whiskers showing the minimum-maximum are represented, and the results were tested for statistically significant differences by the Mann-Whitney test (P = 0.001 and P = 0.0362 in panels F and I, respectively). *, P < 0.05; **, P < 0.01; ***, P < 0.001; ****, P < 0.0001.

