
FIG 5.
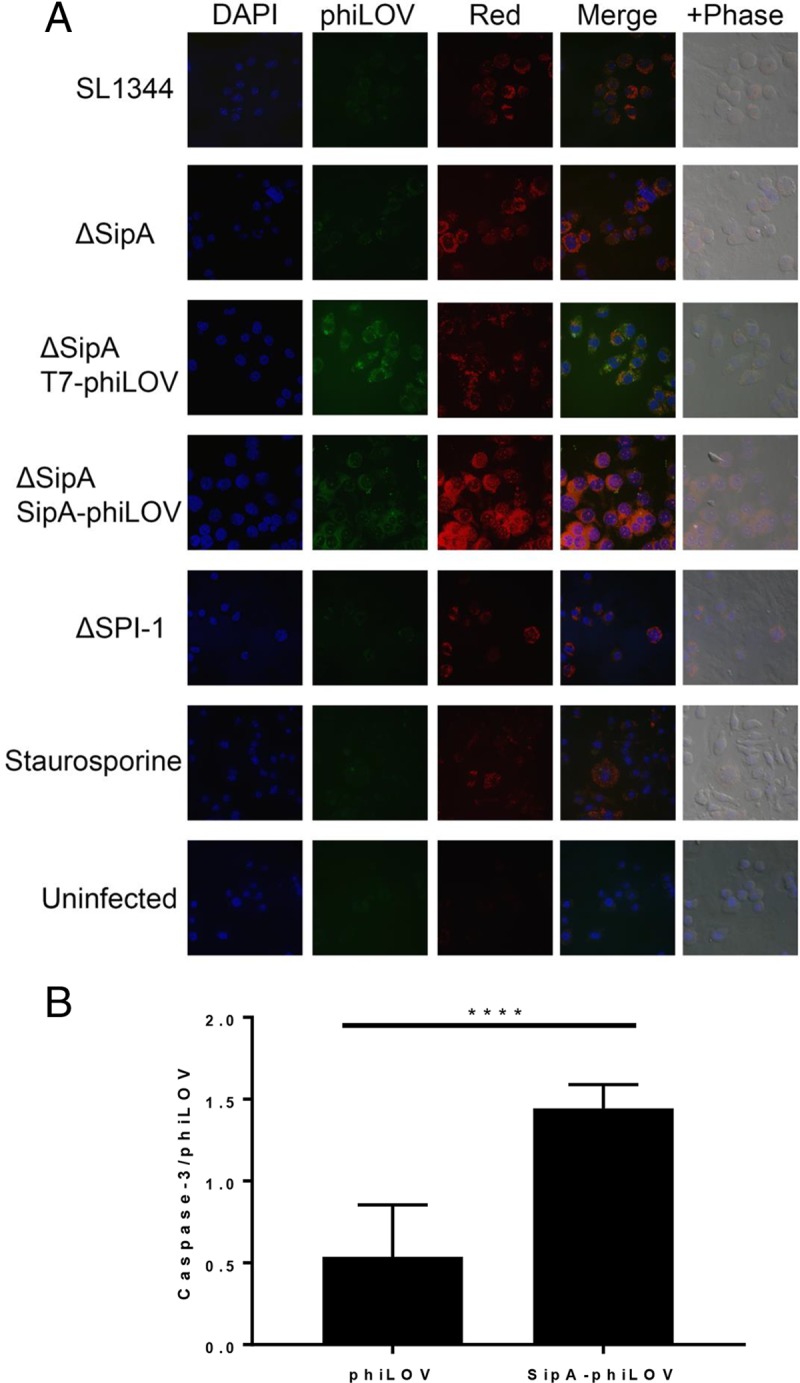
Expression of SipA-phiLOV in RAW264.7 macrophages results in increased levels of activated caspase-3. (A) Infected macrophages were fixed after staining for activated caspase-3 (red) at 2 hpi. High levels of phiLOV (green) expression could be seen in the ΔSipA strain complemented with pSipA-phiLOV and the control pT7-phiLOV plasmids. Nuclei are stained blue with the nuclear stain 4′,6′-diamidino-2-phenylindole (DAPI). (B) Twenty-five fields of view were taken from both phiLOV-infected samples, and fluorescent signals were quantified. To ensure comparability between samples, only fields of view with between 15 and 30 cells were used for analysis. Despite there being on average 1.8-fold more phiLOV signal in the ΔSipA/pT7-phiLOV-infected cells, ΔSipA/pSipA-phiLOV induced 1.6-fold more activated caspase-3. Statistically significant differences detected by Student's t test are denoted. P values: *, <0.05; **, <0.01; ***, <0.001, ****, <0.0001.