Figure 4.

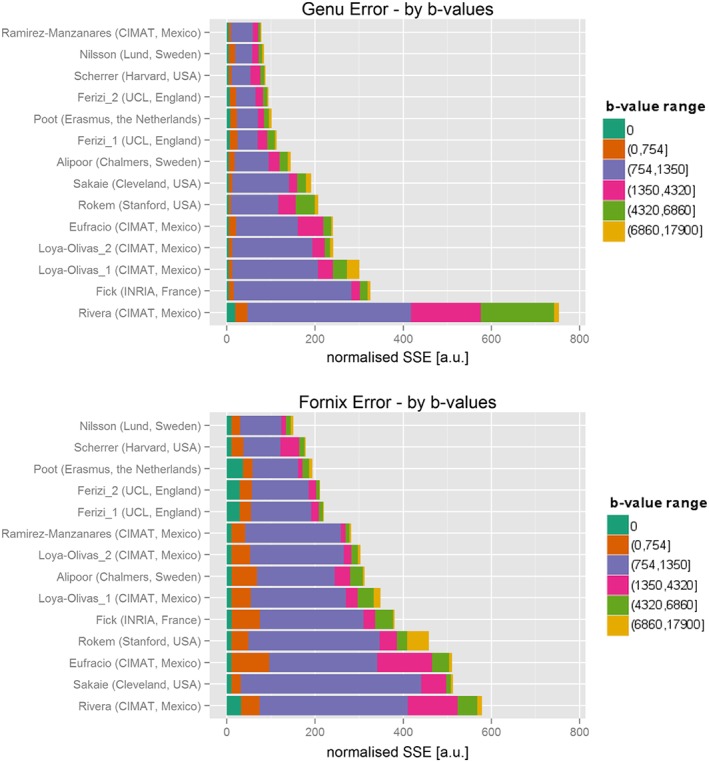
Overall ranking of models by sum‐of‐squared‐errors (SSE) metric over all voxels in genu (top) and fornix (bottom) ROIs. The colors represent different ranges of b‐value shells

Overall ranking of models by sum‐of‐squared‐errors (SSE) metric over all voxels in genu (top) and fornix (bottom) ROIs. The colors represent different ranges of b‐value shells