
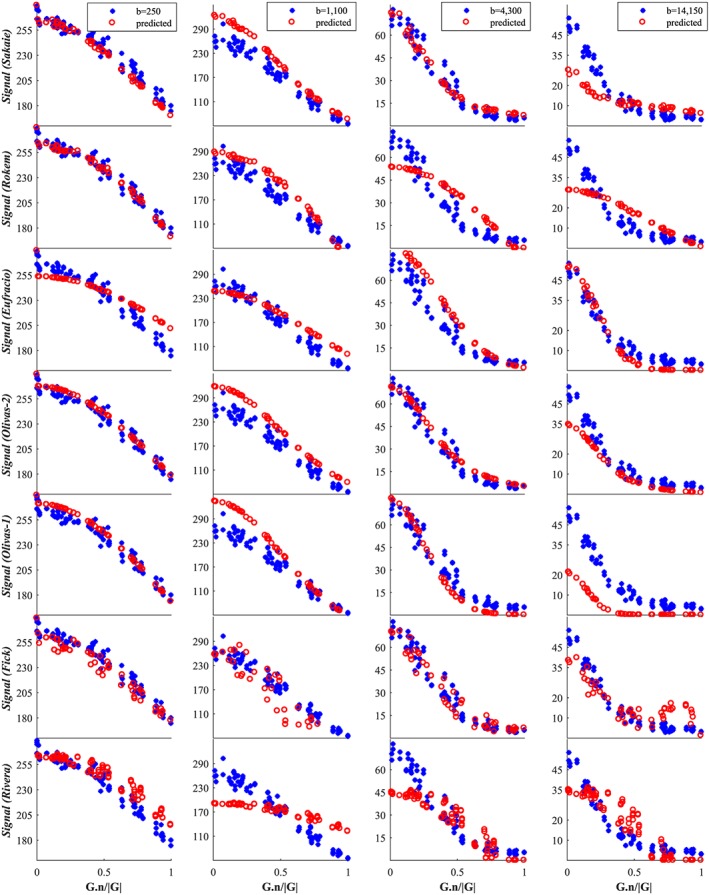
Figure 7.
Genu signal for the second group of 14 models. Raw testing data are shown by blue stars, while red circles denote the model‐predicted data. The x‐axis is the cosine of the angle between G and n
Official websites use .gov
A
.gov website belongs to an official
government organization in the United States.
Secure .gov websites use HTTPS
A lock (
) or https:// means you've safely
connected to the .gov website. Share sensitive
information only on official, secure websites.
Genu signal for the second group of 14 models. Raw testing data are shown by blue stars, while red circles denote the model‐predicted data. The x‐axis is the cosine of the angle between G and n