Figure 9.

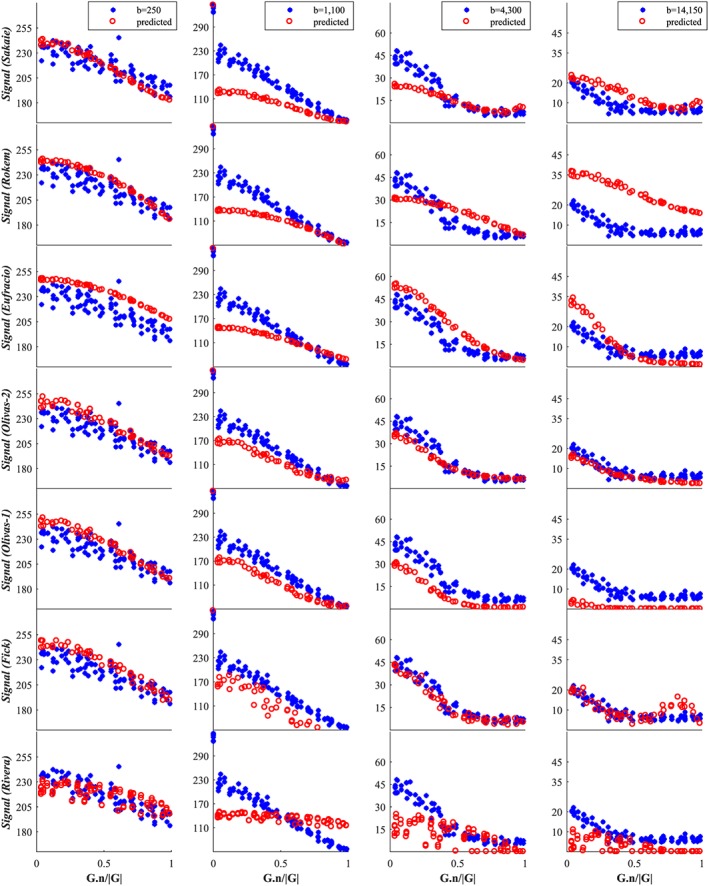
Fornix signal for the second group of 14 models. Raw testing data are shown by blue stars, while red circles denote the model‐predicted data. The x‐axis is the cosine of the angle between G and n

Fornix signal for the second group of 14 models. Raw testing data are shown by blue stars, while red circles denote the model‐predicted data. The x‐axis is the cosine of the angle between G and n