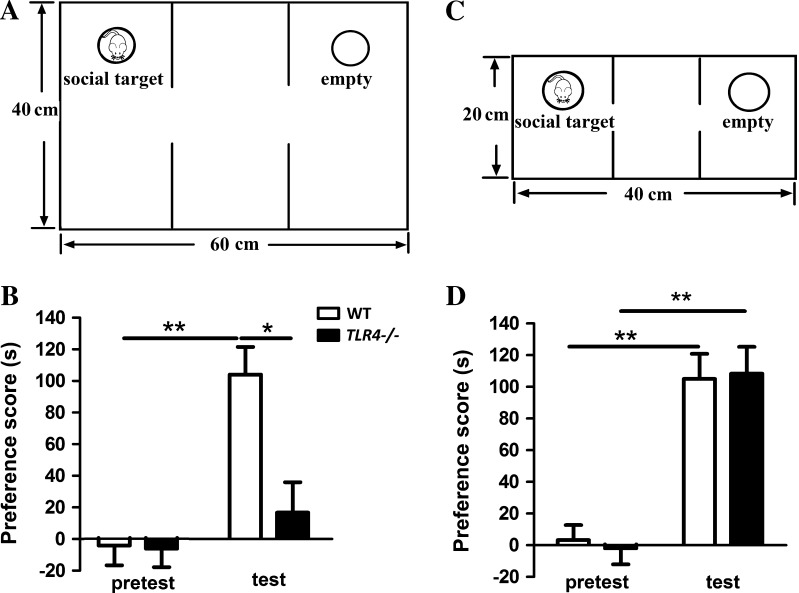
Fig. 3.
Effects of TLR4 deficiency on mouse social behavior. A. Schematic of the large 3-chamber social interaction apparatus with choice between a cage containing a novel mouse and an empty cage. B. Bar graphs showing the preference scores for a conspecific stranger mouse in the large apparatus. The preference score of TLR4 −/− mice (n = 7) was lower than that of WT mice (n = 8) in the test phase. C. Schematic of the small social interaction apparatus. D. Bar graphs showing the preference scores for a conspecific stranger mouse in the small apparatus. There was no difference in the preference score between WT and TLR4 −/− mice. *P < 0.05, **P < 0.01.

