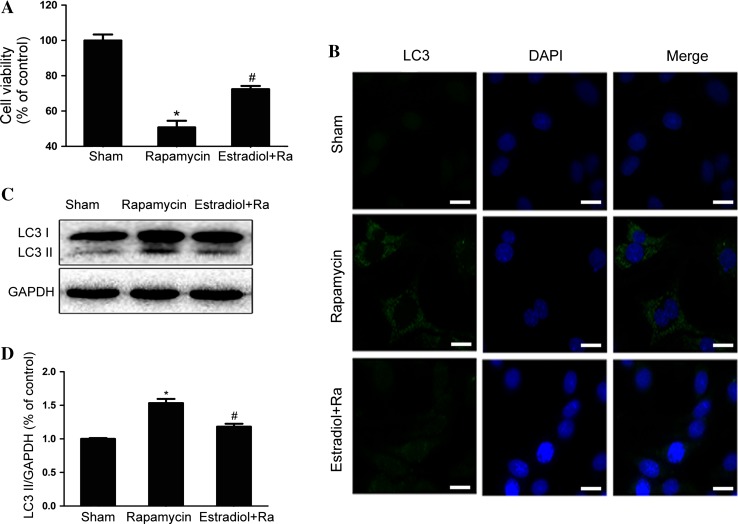
Fig. 6.
A CCK8 results from PC12 cells treated by rapamycin with or without E2 pretreatment. B Immunofluorescence staining for LC3 (green), nuclei labeled with DAPI (blue). C Protein levels of LC3 in the sham, rapamycin, and rapamycin + E2 groups. D Optical density analysis of LC3II/GAPDH from (C). *P < 0.05 vs sham group, # P < 0.01 vs rapamycin group, n = 3 per group. Scale bar 10 μm.

