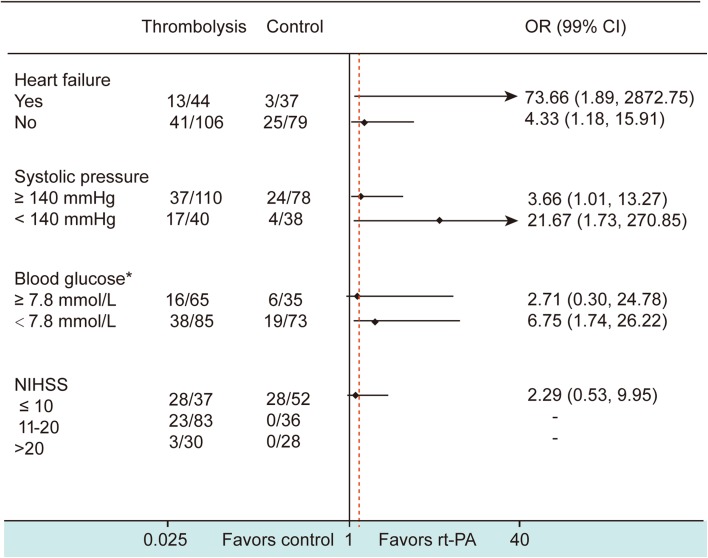
Fig. 2.
Effect of thrombolysis on a favorable outcome (mRS 0–1 at 3 months) in stroke patients with atrial fibrillation. Data on the left represent the number of patients with mRS 0–1 at 3 months/total number of patients in each subgroup divided according to the variables heart failure, systolic pressure, blood glucose, and NIHSS score. Asterisk eight patients lacked blood glucose data at admission. The treatment OR in each subgroup has been adjusted for gender, smoking, drinking, and other key variables (heart failure, systolic pressure, blood glucose, and NIHSS score at admission). Diamonds represent the OR value. Lines without arrows indicate the range of 99%CI. Lines with arrows mean that the OR or 99%CI exceeds the upper limit of the scale (40) shown at the bottom. The red dash line shows the location of total OR of the effect of rt-PA therapy versus conventional therapy on favorable outcome.

