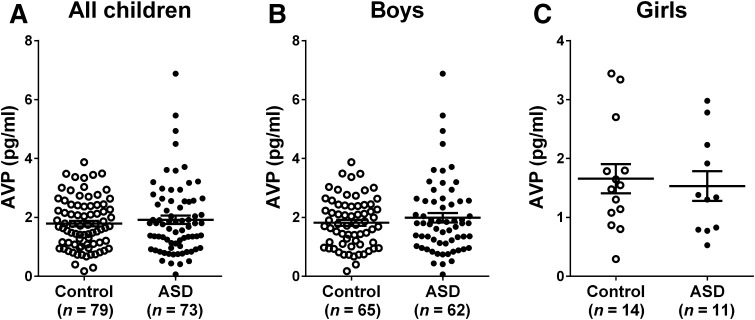
Fig. 2.
Plasma concentrations of AVP in control and ASD children. The levels in the two groups were comparable (A). Boys with ASD did not differ from normal boys with respect to plasma AVP (B), nor were there significant difference between girls (C). All values are presented as mean ± SEM (AVP, arginine-vasopressin; ASD, autism spectrum disorder).

