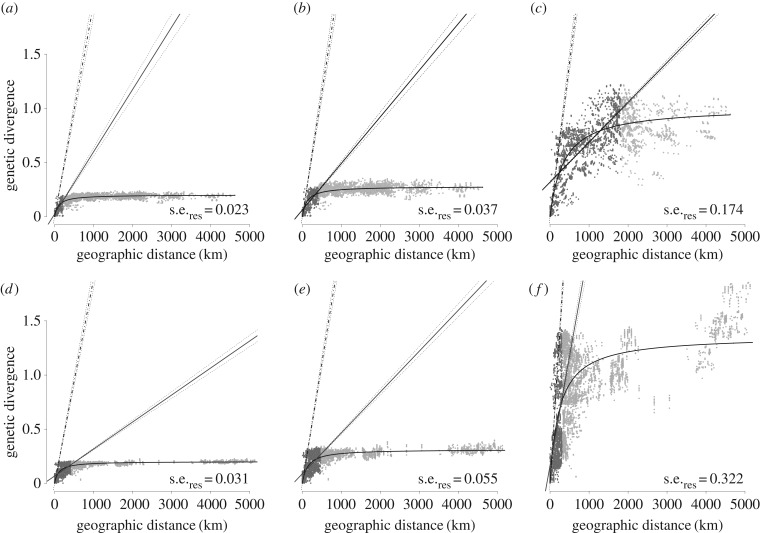
Figure 2.
Relationships between geographical distance and genetic divergence among European hantaviruses. For PUUV (a–c) and TULV (d–f) genetic divergence is inferred either as p-distance (a,d), under the TrN + I + G model of nucleotide evolution (b,e), or as branch lengths in the Bayesian tree reconstruction (figure 1) (c,f). Dark grey points and the solid line (dotted lines: 95% CIs) represent the linear regression over the short-distance partition derived from fitting two linear regressions simultaneously (see text). Light grey data points represent the long distance partition with flat slope. Curves represent the saturation growth rate model (SGR; see text) with residual standard errors (s.e.res). The slope of the derivation of the SGR at zero distance is indicated by the hatched line with 1% and 99% quantiles from 1000 bootstraps.

