
Figure 1. Tissue specific regulation of the IRE1 endonuclease activity in cDCs.
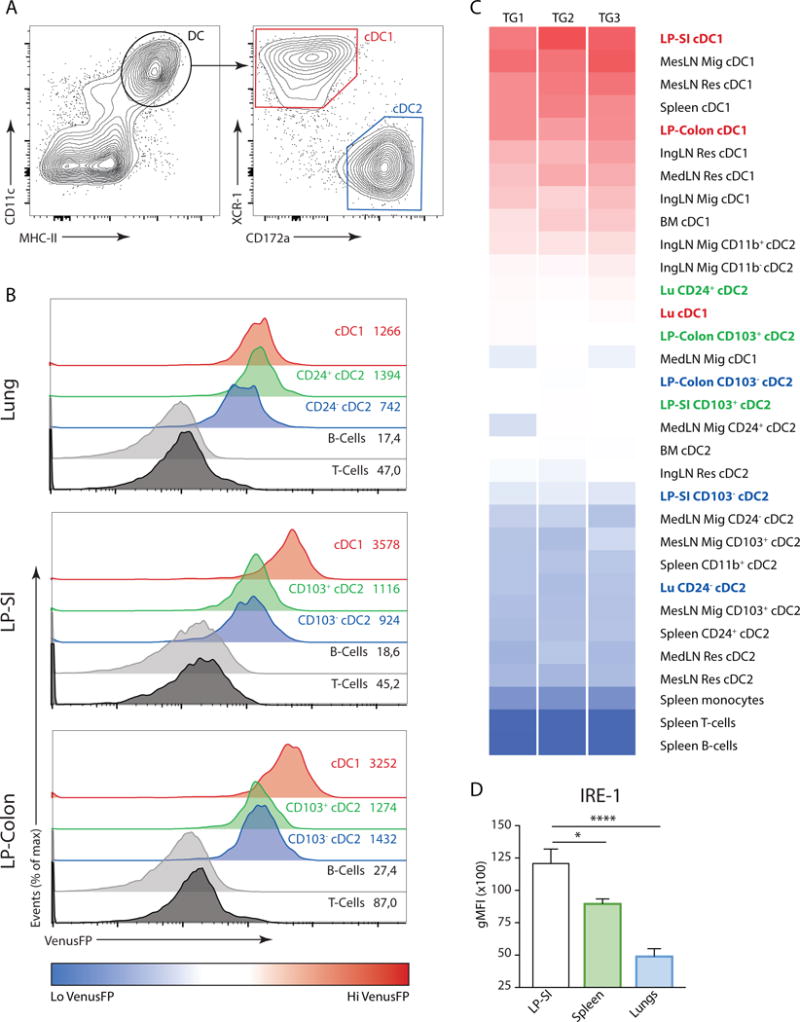
(A) Global gating strategy of cDCs, regardless of tissue origin. Graphs of spleen cDCs are shown. (B) ERAI VenusFP expression in lung (top), lamina propria of small intestine (LP-SI) (middle) and LP-colon (bottom histograms) in T-cells, B-cells and cDCs from ERAI Tg animals. Values depict geometrical mean fluorescence (gMFI) obtained from 1 representative sample. (C) Heat map analysis of ERAI VenusFP fluorescence in cDC1s and cDC2s derived from various organs. Splenic B-cells, T-cells and monocytes were used as immune cell controls for VenusFP levels. cDCs derived from lungs, small intestine and colon are highlighted. Data is representative of 2 independent experiments. (D) Fluorescence measured by flow cytometry of splenic, lung and LP-SI WT cDC1s stained with an antibody raised against IRE1. Bar graphs represent mean gMFI +/− S.E.M (n=4-6-6). Kruskal-Wallis test with Dunn’s multiple comparisons. Data is representative of 3 independent experiments.