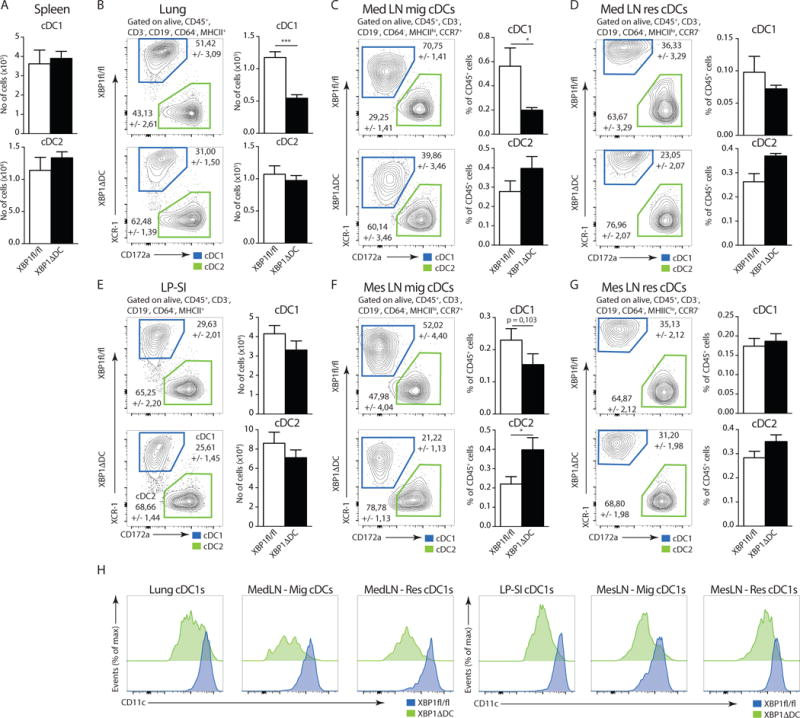
Figure 2. Loss of XBP1 in CD11c+ cells disrupts the cDC compartment in peripheral organs.

(A) Number (no) of cDC1s and cDC2s in the spleen of Xbp1fl/fl and XBP1ΔDC mice (n=6-8). (B) Distribution of cDC1s and cDC2s in lungs of Xbp1fl/fl and XBP1ΔDC mice. Bar graph depicts mean no of cells +/− S.E.M (n=6-7). P=0.0007, Mann-Whitney test. (C–D) Distribution of migratory (CCR7+) (C) and resident (CCR7−) (D) cDC1s and cDC2s in the mediastinal lymph node (MedLN) of Xbp1fl/fl and XBP1ΔDC mice. Bar graphs represent mean percentage +/− S.E.M. of migratory or resident cDCs relative to all CD45+ cells (n=11-14). P=0.0128, Mann-Whitney test. (E) Distribution of LP-SI cDC1s and cDC2s of Xbp1fl/fl and XBP1ΔDC mice. Bar graph depicts mean no (+/− S.E.M.) of cDC1s and cDC2s (n=6-8). (F–G) Distribution of migratory (F) and resident (G) cDC1s and cDC2s in the mesenteric lymph node (MesLN) of Xbp1fl/fl and XBP1ΔDC mice. Bar graphs represent mean percentage (+/− S.E.M.) of cDC1s and cDC2s relative to all CD45+ cells (n=11-14). P=0.0372, Mann-Whitney test. (H) CD11c expression in cDC1s from different organs of Xbp1fl/fl (blue) and XBP1ΔDC mice (green). Data is representative of 2 (C,D,F,G) or at least 3 independent experiments (A,B,E,H).
