
Figure 4. XBP1 deficient cDC1s display normal development.
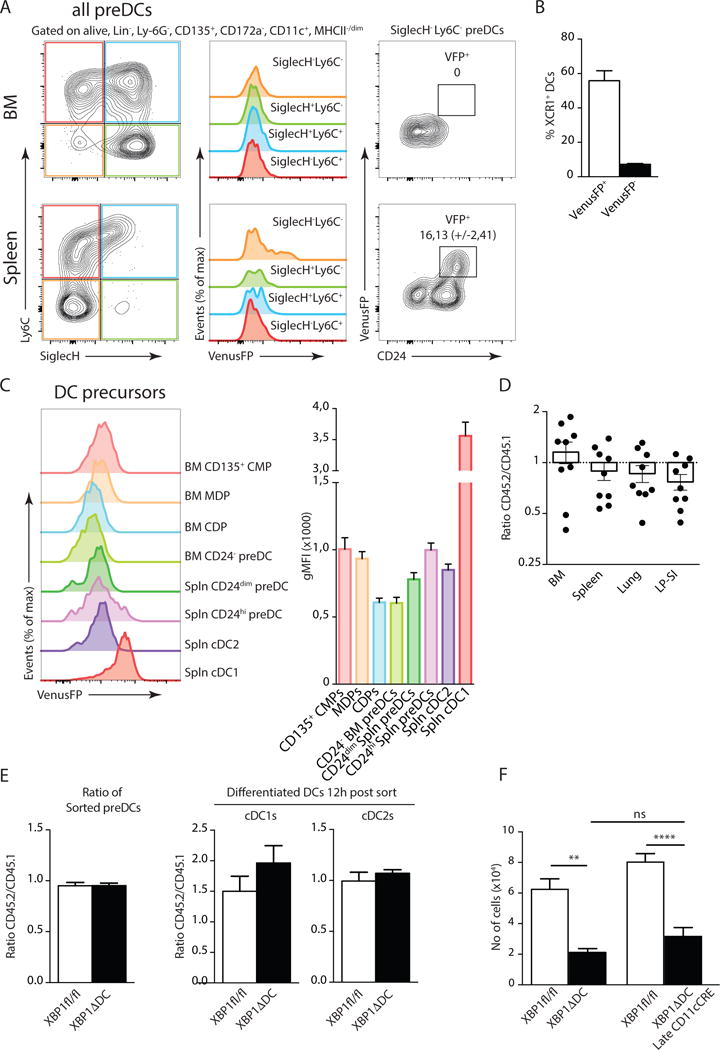
(A) VenusFP expression in BM and splenic pre-DC populations defined by SiglecH and Ly6C staining (left and middle plots). Expression of CD24 and VenusFP in SiglecH+ Ly6C+ pre-DCs (right plots). Numbers represent mean percentage of VenusFP+ pre-cDC1s (+/− S.E.M.). (n=3). (B) Percentage of XCR1+ cDCs relative to cDCs after 24h culture in-vitro of sorted ERAI VenusFP+ or VenusFP− pre-DCs in presence of Flt3L (n=4). (C) Expression of ERAI VenusFP in Flt3+ (CD135+) progenitor cells of cDCs. (CMP, Common Myeloid Progenitor, MDP, Macrophage Dendritic Cell Progenitor, CDP, Common DC progenitor). Bar graphs represent gMFI plus S.E.M. (n=8) (D) Ratio of bone marrow, spleen, lung or LP-SI CD45.2 XBP1ΔDC pre-DCs over CD45.1 wild type counterparts. Each symbol represents an individual mouse. Bar graph represents mean +/− S.E.M. (E) Ratio of CD45.2 Xbp1fl/fl or XBP1ΔDC pre-DCs over CD45.1 counterparts, directly after sort (left plot), or after overnight development into cDC1s or cDC2s in presence of Flt3L (right plot). (n=4-6) (F) No of lung cDC1s in Xbp1fl/fl and XBP1ΔDC and XBP1ΔDC-Late. Bar graphs represent mean +/− S.E.M. (n=at least 11 per group). Kruskal-Wallis test with Dunn’s multiple comparisons. Data is representative of 2 (B,C,D,E,F), or 4 (A) independent experiments.