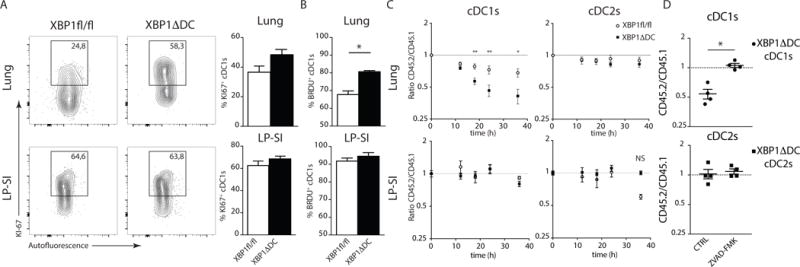
Figure 5. Absence of XBP1 cripples lung cDC1 survival.

(A) Intracellular staining of Ki67 in lung or LP-SI derived cDC1s. Figure depicts percentage of Ki67+ cells in 1 representative animal. Bar graph represents mean +/− S.E.M. (n=5). (B) In-vivo BrdU incorporation after 3 days of exposition to BrdU in drJNKing water. Bar graphs represent mean +/− S.E.M. (n=4). P=0.0286(Lung), Mann-Whitney test. (C) Sorted lung or LP-SI CD45.2 Xbp1fl/fl and XBP1ΔDC cDC1s (left plot) or cDC2s (right plot) mixed with CD45.1 counterparts and cultured in medium without Flt3L. Ratios were monitored over time. Each symbol represents mean ratio +/− S.E.M. (Lung n=8, LP-SI n=7 or 3). Mann-Whitney test P(18h)=0.0026, P(24h)=0.0085, P(36h)=0.0117. (D) Sorted lung CD45.2 XBP1ΔDCs cDC1 (top) and cDC2 (bottom) were mixed with CD45.1 counterparts and treated overnight with zVAD-fmk or vehicle. Ratio of Ann-V− cells is given. Each symbol represents 1 mouse. Mean ratio +/− S.E.M. is given (n=4). For additional details see (Suppl Fig 4A). Data is representative of 1 (A,B), 2 (D) or 4 (C) independent experiments.
