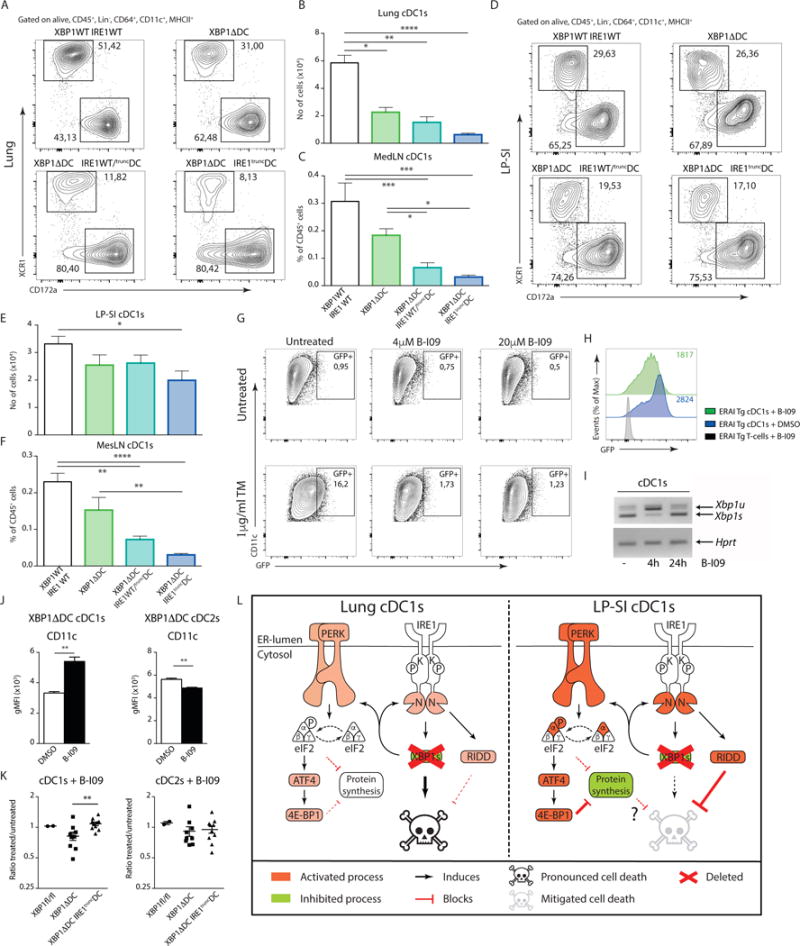
Figure 9. Organ specific RIDD activation orchestrates cDC1s survival in the face of chronic ER stress.

(A) Distribution of cDC1s and cDC2s in the lungs of given genotypes. Numbers are percentage of cDC1s and cDC2s relative to all cDCs from 1 representative sample. (B) Number of lung cDC1s in Xbp1fl/fl/Ire1fl/fl, XBP1ΔDC, XBP1ΔDC/IRE1WT/truncDC and XBP1ΔDC/IRE1truncDC mice. (C) Percentage of Mig cDC1s in the MedLN of Xbp1fl/fl/Ire1fl/fl, XBP1ΔDC, XBP1ΔDC/IRE1WT/truncDC and XBP1ΔDC/IRE1truncDC. (D) Distribution of cDC1s and cDC2s in the LP-SI of given genotypes. Numbers in graphs are percentage of cDC1s and cDC2s relative to all cDCs from 1 representative sample. (E) Number of LP-SI cDC1s in Xbp1fl/fl/Ire1fl/fl, XBP1ΔDC, XBP1ΔDC/IRE1WT/truncDC and XBP1ΔDC/IRE1truncDC mice. (F) Percentage of Mig cDC1s in the MesLN of Xbp1fl/fl/Ire1fl/fl XBP1ΔDC, XBP1ΔDC/IRE1WT/truncDC and XBP1ΔDC/IRE1truncDC. (A–F) Bar graphs represent mean +/− S.E.M. (n=at least 5). Kruskal-Wallis test Dunn’s multiple comparisons. (G) Venus FP expression in in-vitro cultured DCs from ERAi Tg bone marrow. Cells were treated with tunicamycin (TM) and increasing doses of the IRE1 inhibitor B-I09. Percentage of VenusFP+ cells are given. (H) VenusFP expression in ERAi transgenic splenic cDC1s upon in-vivo treatment with B-I09 or vehicle control. Geometrical mean fluorescence is given. (I) PCR analysis of unspliced Xbp1 mRNA (Xbp1u) and spliced Xbp1 mRNA (Xbp1s) in FACS sorted splenic cDC1s from wild-type C57BL/6 mice treated with B-I09 for 0, 4 or 24 hours. mRNA encoding Hprt serves as a loading control. (J) CD11c expression in XBP1 deficient MesLN cDC1s and cDC2s treated with B-I09 or vehicle control. Bar graphs represent mean +/− S.E.M. (n=5). Mann-Whitney test, ** : p<0.01. (K) Ratios of B-I09 treated over vehicle treated cDC1s and cDC2s derived of XBP1fl/fl, XBP1ΔDC and XBP1ΔDC/IRE1truncDC MesLNs. Each dot represents an individual mouse. Error bars depict S.E.M. Mann-Whitney test, ** : p<0.01. Data is representative of 2 (A–F,H,J,K) independent experiments or 1 (G,I) experiment. (L) Graphical summary of main events downstream of XBP1 deficiency in lung or intestinal cDC1s. Green represents inhibitory events, red equals activation. Loss of XBP1 in both lung and intestinal cDC1s activates both IRE1 and PERK. This is only modest in the lung and more pronounced in the LP-SI, resulting into a block in cell death in the LP-SI in a RIDD dependent manner. At this stage it is unclear whether the PERK mediated adaptive downregulation in protein synthesis in the LP-SI also contributes to cell survival.
