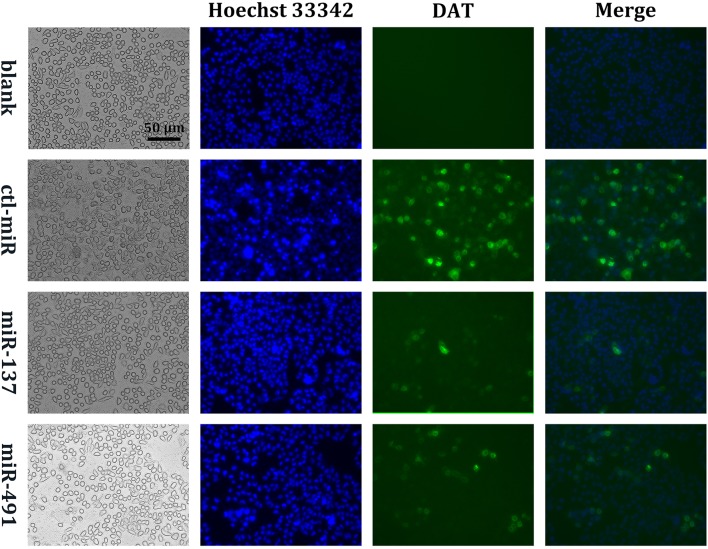
Fig. 4.
Fluorescence microscopic imaging of the DAT. After being treated with miRNAs for 72 h, DAT-overexpressing HepG2 cells were incubated with 10 μg/mL Hoechst 33342 at 37 °C for 15 min. HepG2 cells were visualized and photographed using a fluorescence microscope with a 20× objective. ‘Blank’ indicates that cells did not overexpress DAT (representative result from three independent experiments; scale bar 50 μm).

