Figure 7.
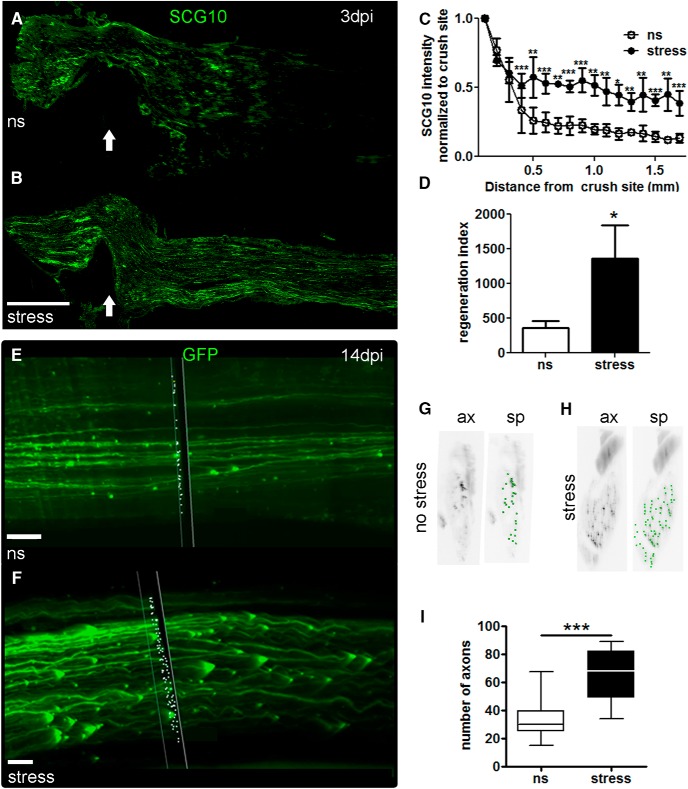
Stress enhances regeneration of injured sensory axons in vivo. A, B, Representative longitudinal sections of sciatic nerves from mice that received a crush injury alone or 1 h of restraint followed by crush injury. Nerves were immunostained with SCG10. Arrow indicates crush site. Scale bar, 500 µm. C, Stress increased SCG10+ intensity distal to the crush site by 3 dpi. Results are expressed as mean ± SEM. **p < 0.001, ***p < 0.0001 for two-way ANOVA for distance and condition; N = 3 per group, four sections per animal. D, Stress increases the regeneration index. Results are expressed as mean ± SD. *p < 0.01, unpaired t test. E-I, Representative images of cleared intact sciatic nerve distal to the crush site in ns (E) and stressed (F) mice. The plane through the nerve (black box with white outline) and the white dots show the results of the Spots algorithm (Bitplane) used for axon quantification. Scale bar, 70 µm. G, H, A single cross section view through the intact sciatic nerve rendered in black and white for easy viewing (left panel; axons: ax). Green dots indicate axon cross sections and show the outcome of the spots algorithm (sp). I, Summary statistics for the experiment are shown in a box plot for the average number of axons measured every 0.5 mm distal to the crush site in the sciatic nerve in ns and stressed mice. Average, 33 ns versus 64 stressed, ***p < 0.0001; minimum, 15 ns versus 34 stressed; median, 30 ns versus 63 stressed; maximum, 68 ns versus 89 stressed; N = 3 per group.

