Figure 1.
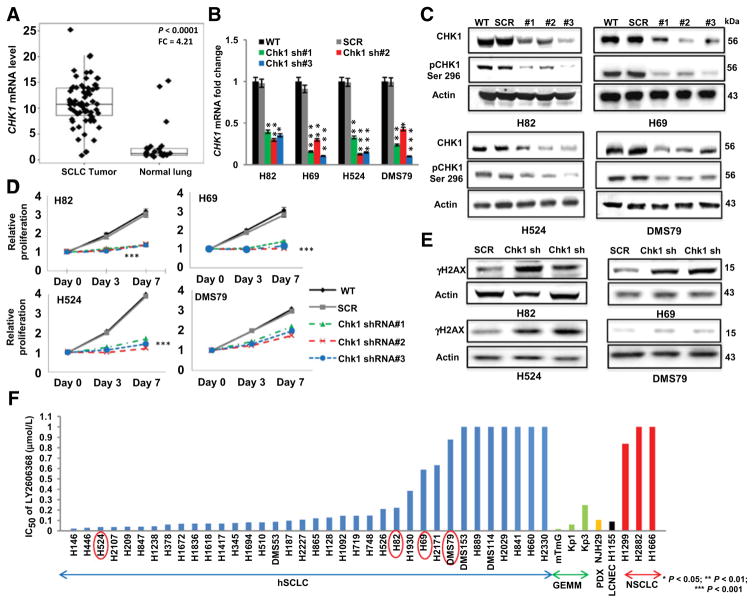
CHK1 is overexpressed in SCLC, and CHK1 inhibition abrogates the proliferation of genotypically and phenotypically distinct SCLC cell lines. A, RNA sequencing analysis showing the gene expression profile of CHK1 in 68 SCLC and 26 normal lung tissue samples. SCLC tumors had significantly higher (P < 0.0001) CHK1 gene expression levels than normal lung tissue, with a fold change (FC) of 4.21. P <0.0001 was obtained by ANOVA. B, shRNA-mediated knockdown of CHK1 in a subset of human SCLC cell lines. Three separate shRNAs (sh#1, sh#2, and sh#3) targeting CHK1 were applied to each of the cell lines H82, H69, H524, and DMS79. Parental cells (no shRNA; WT) and scramble shRNA cells (SCR) were used as controls in each case. The knockdown efficiency was measured by quantitative real-time PCR analysis of the target gene. GAPDH was used as the reference in this analysis. Data represent mean ± SEM (error bars) of three independent experiments. *, P < 0.05; **, P < 0.01; ***, P < 0.001. C, Western blot analysis confirming the knockdown efficiency of total and phosphorylated (Ser296) CHK1 in total protein lysates from the parental (WT), scramble (SCR), and CHK1-knockdown cell lines. Actin was used as the loading control. D, Proliferation assay results, including parental (WT), scramble (SCR), and CHK1-knockdown cell lines, demonstrating the effect of CHK1 inhibition on the proliferation of SCLC cells. Data represent the mean ± SEM (error bars) of three independent experiments. ***, P < 0.001. E, Western blot analysis showing elevated phospho-H2AX (γH2AX) levels in the total protein lysates of the scramble (SCR) SCLC cell line and two shRNA-transfected SCLC cell lines. The CHK1-knockdown cells showed higher levels of H2AX than the scramble control cells. Actin was used as the loading control. F, Cell viability in response to treatment with LY2606368 in a panel of human SCLC (hSCLC) cell lines (blue bars), GEMM-derived SCLC cell lines (green bars), a PDX-derived cell line (yellow bar), a large-cell neuroendocrine carcinoma (LCNEC) cell line (black bar), and NSCLC cell lines (red bars). The genetic profile information and mean half-maximal inhibitory concentration (IC50) values for each cell line are presented in Supplementary Table S1 and Supplementary Table S3.

