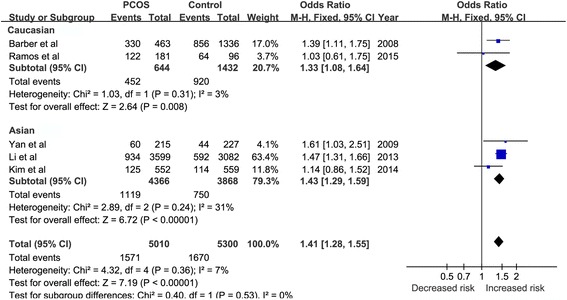
Fig. 3.

The association between FTO rs9939609 A/T polymorphism and risk of PCOS in subgroup model. The analysis was stratified by race. AA + AT vs. TT in subgroup (Caucasian and Asian) analysis of HWE > 0.05. The solid squares represent the ORs from the individual studies, horizontal lines represent corresponding 95% CIs. The pooled ORs and 95% CIs are presented as diamonds
