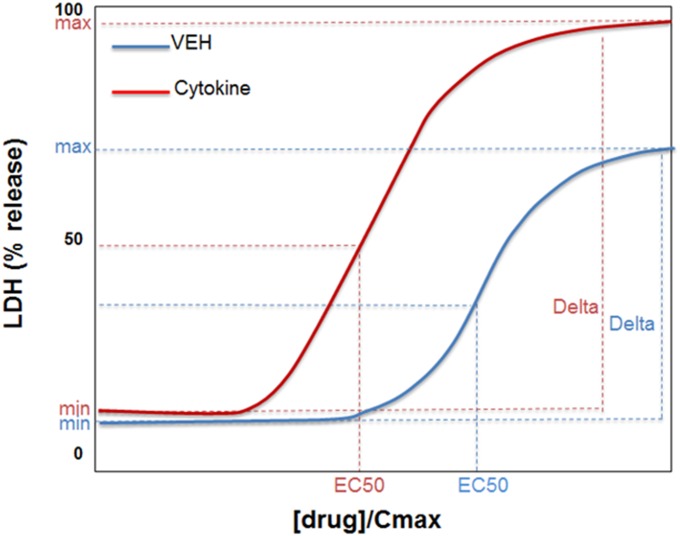
Fig. 1.
Depiction of base covariates considered for evaluation. The blue curve represents hypothetical response to drug alone; the red curve represents response to drug in the presence of cytokine. Min is the LDH release in the absence of drug, max is the maximal LDH release. Delta = max(LDH) – min(LDH) for each curve. Although not depicted in the figure, deltadiff = delta cytokine − deltaVEH. EC50 is the [drug]/Cmax value at 50% delta. R10 is not depicted but it represents the [drug]/Cmax value associated with a 10% increase in LDH release above min(LDH).

