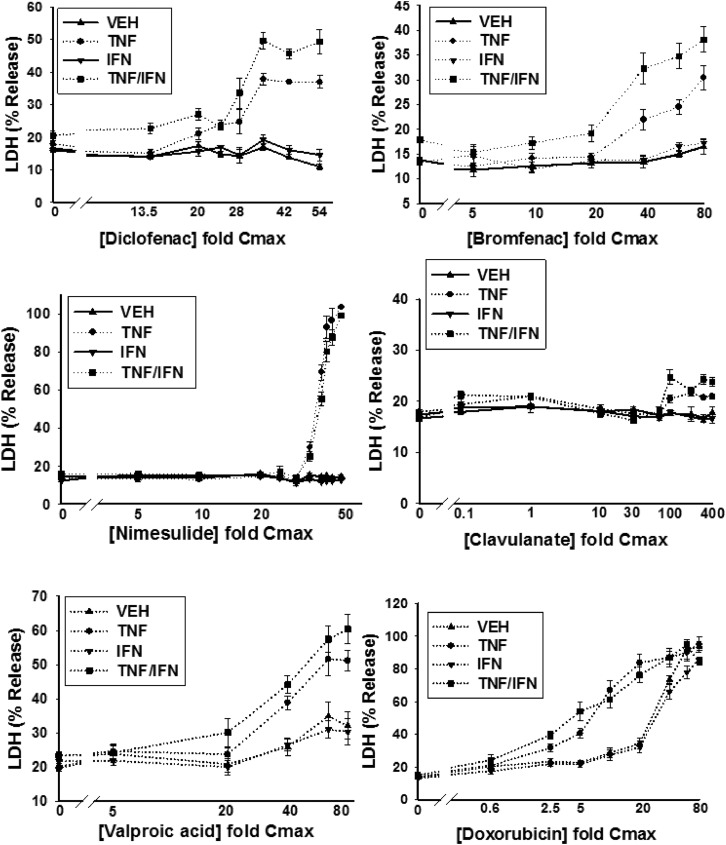
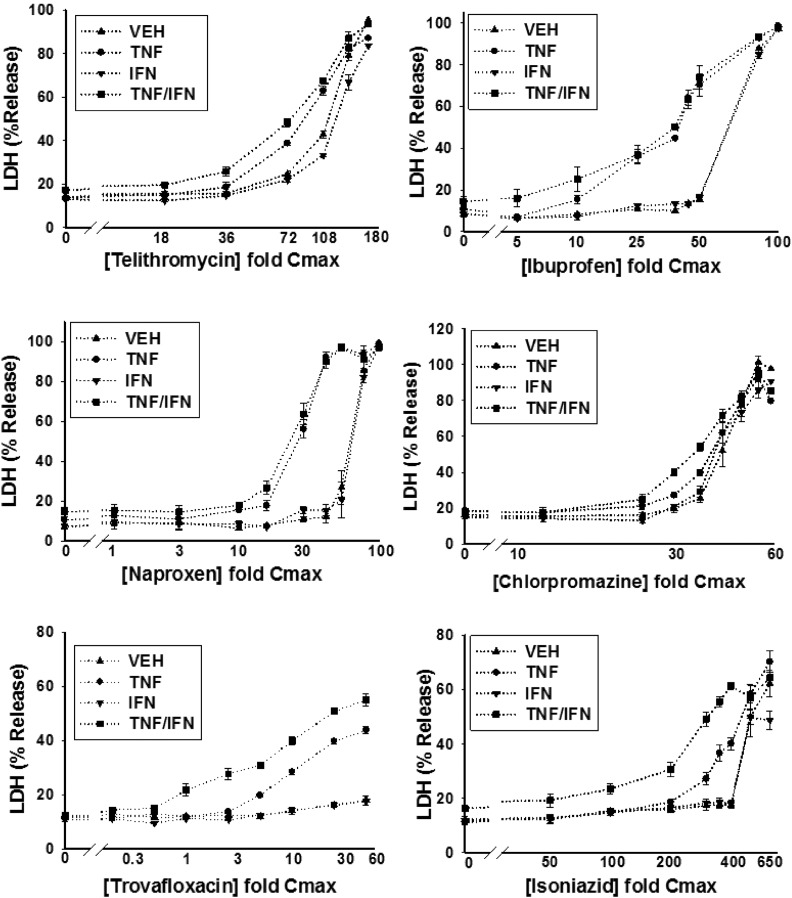
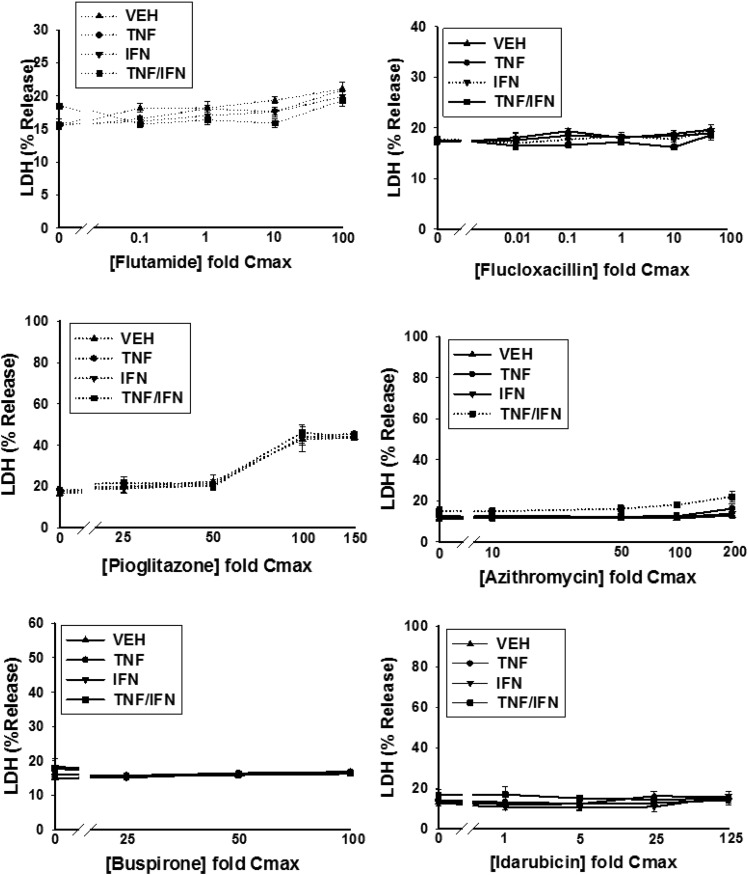
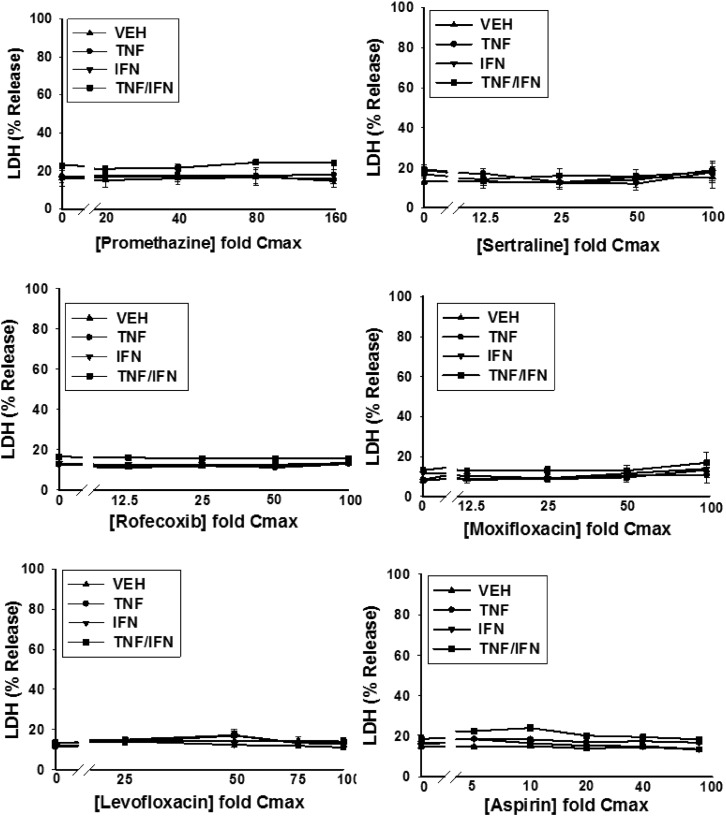
Fig. 2.
Drug/cytokine-induced cytotoxicity: concentration-response. HepG2 cells were treated with 14 drugs associated with IDILI and 10 drugs not associated with IDILI, alone (VEH) and in combination with TNF and/or IFN. Cytotoxicity (% LDH release) was evaluated 24 hours after treatment. The numbers listed on the x-axis represent the concentration of drug relative to Cmax (fold Cmax). Refer to Table 1 for the Cmax information and known IDILI classification for each drug and to the Materials and Methods for the rationale concerning the range of drug concentrations evaluated. Each data point represents the mean ± standard error of the mean (SEM) of at least three separate experiments. The dotted curves indicate that the treatment condition (i.e., VEH, TNF, IFN, or TNF/IFN) resulted in a statistically significant change in LDH from baseline (no drug) at one or more drug concentrations (ANOVA P < 0.01). Solid lines indicate that the treatment condition did not result in a statistically significant change in LDH relative to baseline at any drug concentration (ANOVA P ≥ 0.01). The dotted curves were modeled using a four-parameter logistic function as described in the Materials and Methods to compute parameters describing curve characteristics (minimum cytotoxic effect, maximum cytotoxic effect, EC50, etc.).


