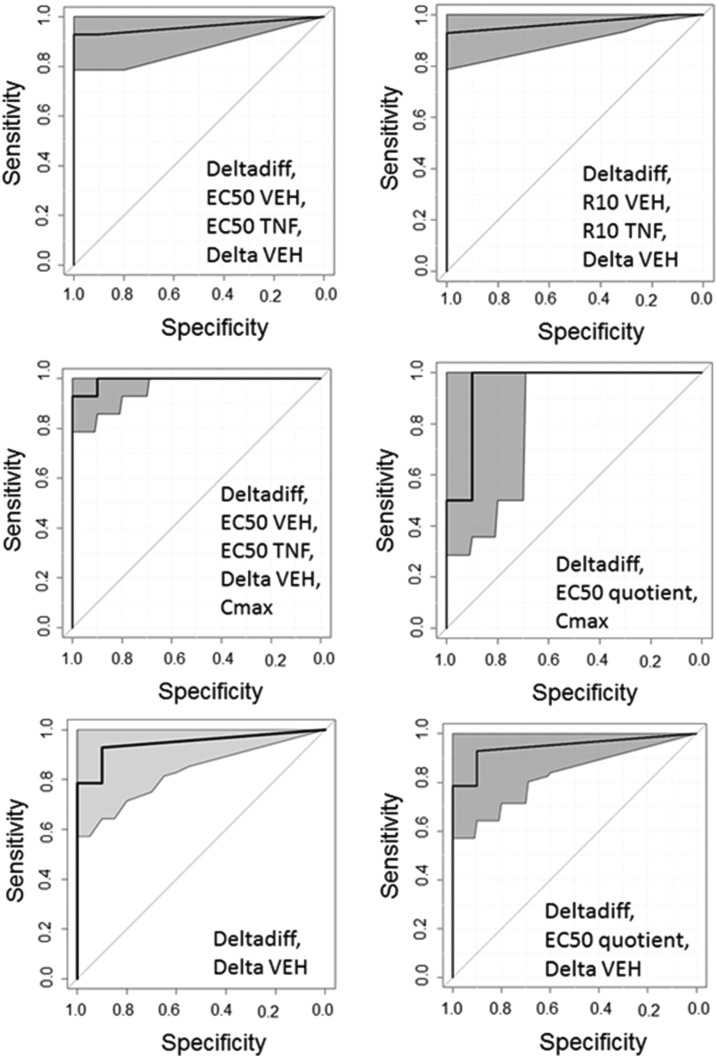
Fig. 7.
ROC curves with an AUC ≥ 0.95. ROC curves for which AUC ≥ 0.95 are depicted. The 95% confidence interval is shaded gray. The covariates incorporated into the model are listed at the bottom-right corner of each ROC curve. The ROC curves shown were not significantly different from each other as determined by DeLong’s test (P > 0.05).

