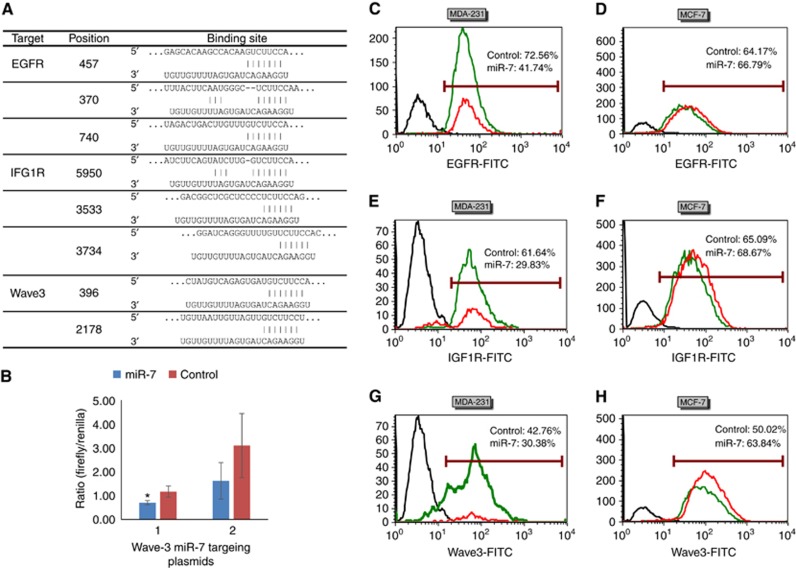
Figure 4.
Protein level of IGF1R, EGFR and wave3 in MDA-MB-231 and MCF-7 cells with response to the treatment of miR-7 Mimic for 48 h. (A) Predicted 3’-UTR sites in the three genes for miR-7 using online tools. (B) Validation of the miR-7 target sites in Wave3 using luciferase assay. (C–H) Expression of the cellular protein molecules determined using flow cytometry after immunostaining. The primary antibodies used were anti-EGFR (SC-71034. Santa Cruz Biotechnology, Santa Cruz, CA, USA), anti-IGF1R (SC-712. Santa Cruz Biotechnology), and anti-Wave3 (2806. Cell Signaling Technology), respectively. Isotype antibodies were used as background control. Black histogram: background signal after staining with an isotype primary antibody. Green histogram: Protein expression after treatment with mimic control. Red histogram: protein expression after treatment with miR-7 mimic. Percentages of protein expression was shown after gating against background noise in the overlay plots. (C and D) EGFR expression. (E and F) IGF1R expression. (G and H) Wave3 expression. *P<0.05. A full colour version of this figure is available at the British Journal of Cancer journal online.

