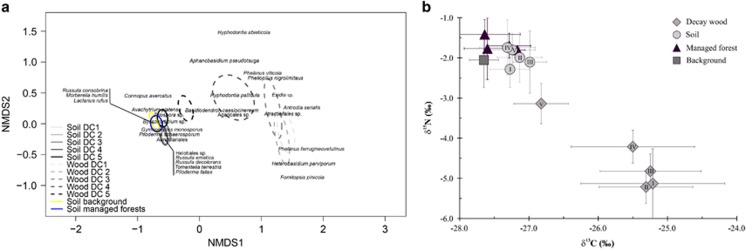
Figure 3.
Community composition (a) and nitrogen and carbon stable isotope values (b) in decaying wood and soil. (a) A NMDS plot showing variation of fungal communities in logs from different DC (1–5) in soil adjacent to the logs, soil non-adjacent (soil background) and soil from the additional four managed forests. Ninety-five per cent confidence ellipses of each substrate type are based on the standard errors of the weighted average of sample scores. Species scores of the 30 most abundant operational taxonomic units are plotted to the ordination. (b) The variation in nitrogen and carbon stable isotope values in logs from different DC (I, II, III, IV and V), soil adjacent to the logs (grey circles with symbols I, II, III, IV and V), soil non-adjacent (grey square) and soil from the additional four managed forests (black triangles).

