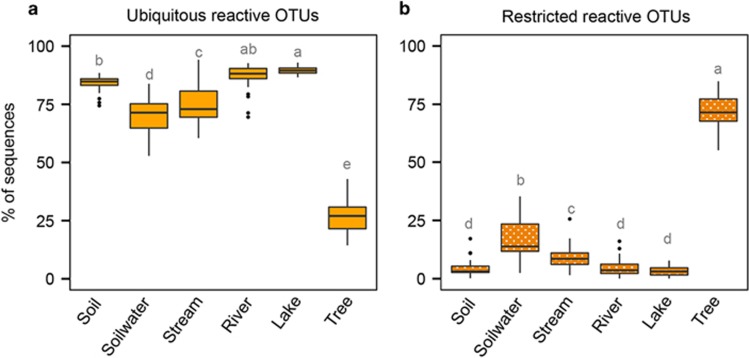
Figure 3.
Contribution of reactive OTUs across communities. Contribution to total bacterial sequences of the OTUs from the ‘reactive’ pool that were detected (a) or not (b) in the three deep samples across the different types of ecosystems. Letters refer to results of an ANOVA with a Tukey’s post hoc test. Different letters indicate significant differences (P<0.05) between types of ecosystems.

