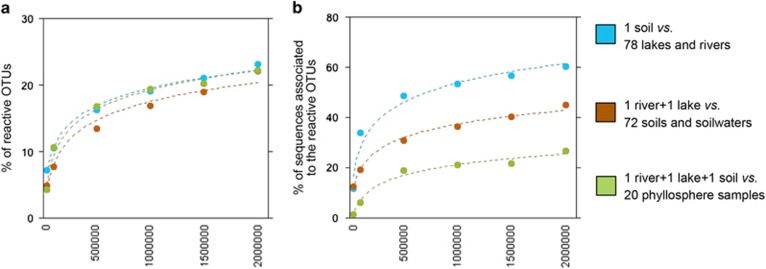
Figure 4.
Recruitment across ecosystem types as a function of sequencing depth. (a) Proportion of the ‘reactive’ OTUs from one type of habitat (aquatic—blue-, terrestrial—brown-, and phyllosphere—green-) detected in a different type of ecosystem as a function of the depth of sequencing for the three comparisons (see legend). (b) Proportion of sequences associated to those detected ‘reactive’ OTUs (of the total sequences considered in each comparison) as a function of the depth of sequencing. For these analyses, the OTU table with the 3 deeply sequenced samples was randomly subsampled to 100 000, 500 000, 1 000 000, 1 500 000 and 2 000 000 sequences per sample. Even though number of OTUs considered in each comparison differed (Supplementary Table S3), these differences did not influence the observed patterns because the percentage of recovered reactive OTUs shown in Figure 4a does not change among comparisons.

