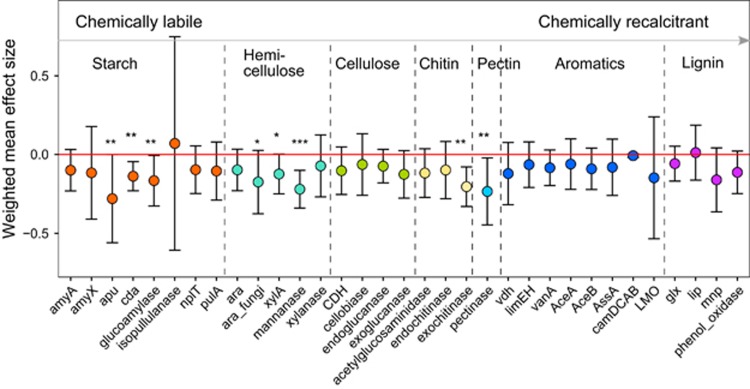
Figure 2.
Effects of climate cooling on relative abundances of C decomposition genes. The weighted mean effect size was calculated by the method of meta-analysis of response ratio. Error bars are at the 95% confidence level. The significance level is indicated by asterisk: ***P<0.001, **P<0.050 and *P<0.100.

