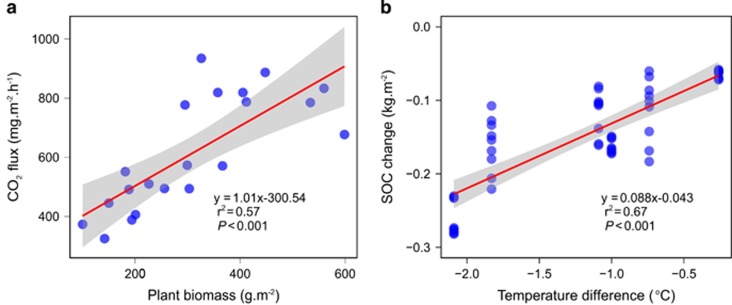
Figure 3.
(a) Correlation between CO2 efflux and plant biomass and (b) correlation between the change of SOC density and temperature difference. Linear regression lines and their 95% confidence limits (shaded) are shown. SOC Change was calculated as the difference in SOC density between transplant soils (cooling) and their corresponding controls. Negative values of SOC changes indicate the decrease of SOC under cooling.

