
Figure 4. Galectin-1 release.
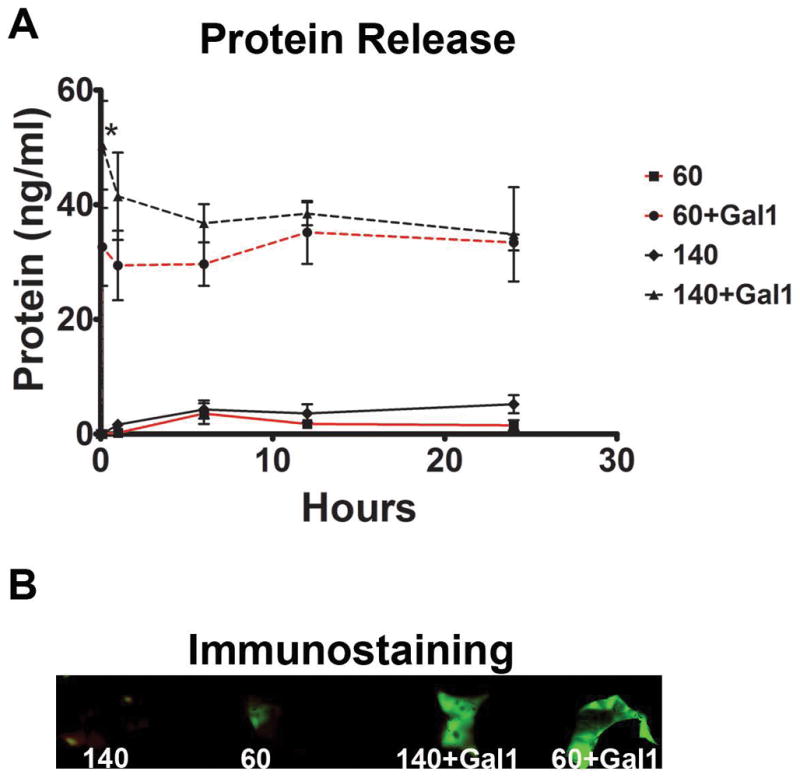
Protein levels were measured at 0, 0.25, 1, 6, 12, and 24 hours using 140 mg/ml and 60 mg/ml electrospun PDO scaffolds with galectin-1 or vehicle (A). * indicates a difference between 60+Gal1 and 140+Gal1 (p < 0.05). Data shown are means of triplicate samples. Images of scaffolds immunostained with anti-galectin-1 antibody demonstrate a larger signal from galectin-1 scaffolds then controls (B).