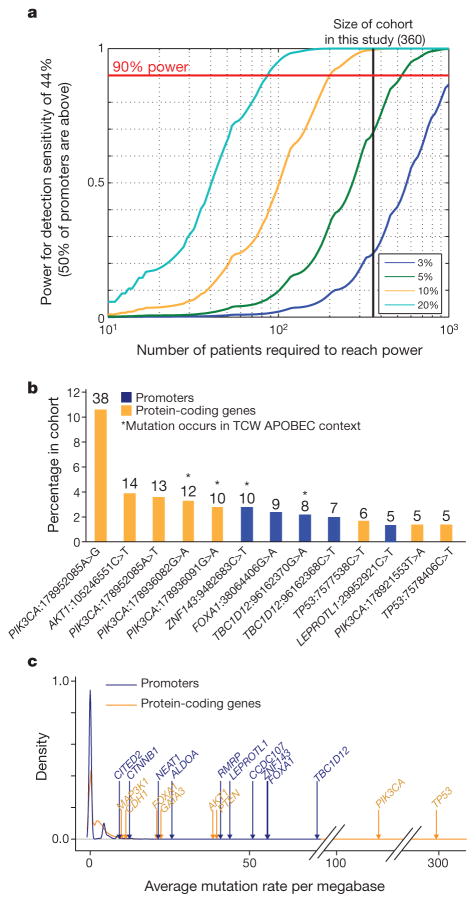
Figure 4. Power analysis of ExomePlus patient cohort.
a, Discovery power in promoter regions. This study is well-powered (>90%) to discover promoters mutated in 10% and 20% but not 5% of patients. b, Percentage of mutational hotspots in coding genes and promoters in our cohort. The total number of hotspot mutations is indicated above the bars (only sites with at least five mutations are shown). c, Distribution of patient-average functional mutation rates for coding genes and promoters.

