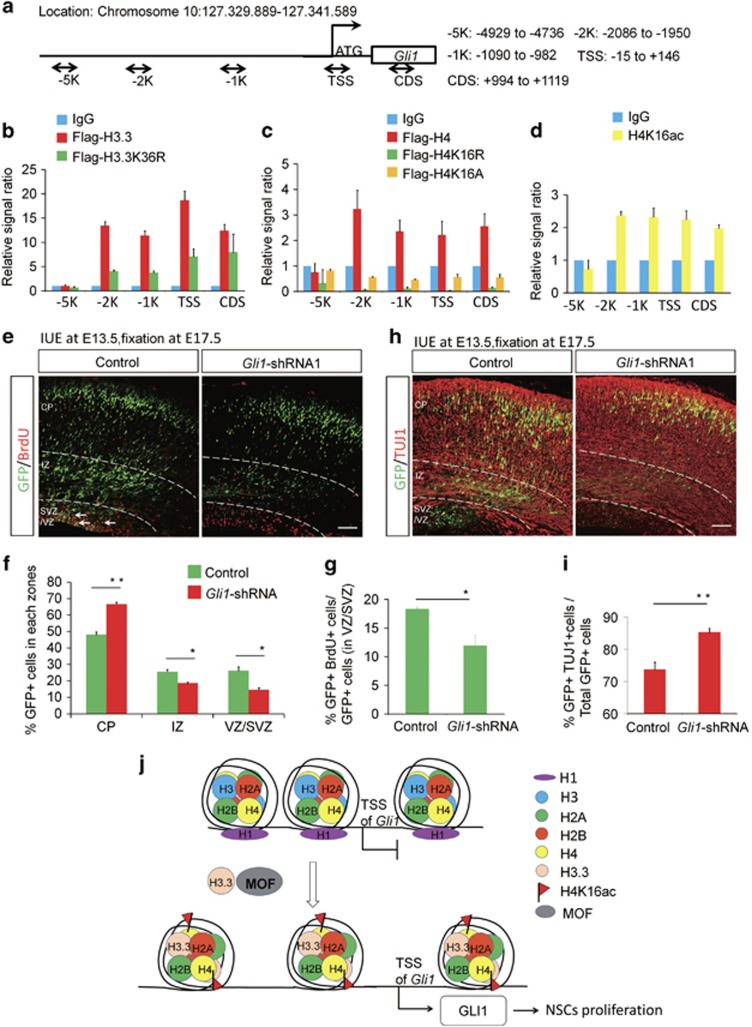
Figure 10.
GLI1 participates in the process of the embryonic neurogenesis. (a) Sketch map shows the different region selected for ChIP- realtime-PCR. (b) Flag-H3.3 binds to the Gli1 promoter region. However, the binding of Flag-H3.3K36R to each region was decreased versus the Flag-H3.3 in the NSCs (n=3 independent experiments; bars represent mean±S.E.M). (c) Flag-H4 binds to the Gli1 promoter and the gene body. However, the binding of Flag-H4K16R and Flag-H4K16A to each region was decreased versus the Flag-H4 in the NSCs (n=3 independent experiments; bars represent mean±S.E.M). (d) H4K16ac binds to the region of the Gli1 promoter in the NSCs (n=3 independent experiments; bars represent mean±S.E.M). (e,f) GLI1 knockdown causes Gli1-shRNA-GFP cell positioning changes in utero. The empty shRNA control or GLI1 knockdown plasmids was electroporated into E13.5 embryonic mouse brains, and the phenotype was analyzed at E17.5. The percentage of Gli1-shRNA-GFP or Control-GFP cells in each region is shown (n=3 independent experiments; error bars represent mean±SEM; *P<0.05). (g) The bar graph shows the BrdU incorporation is reduced in GLI1 knockdown sections. The mouse brain was electroporated at E13.5 and BrdU (50 mg/kg) was injected 2 hours prior to killing at E17.5. The white arrows indicate GFP and BrdU double-positive cells. The bar graph shows the percentage of BrdU and GFP double-positive cells relative to the total GFP-positive cells in the VZ/SVZ (n=3 independent experiments; *P<0.05, bars represent mean±SEM). The scale bar represents 50 μm. (h,i) GLI1 knockdown increases neuronal differentiation. E17.5 brain sections were stained for TUJ1 after the electroporation of the control or GLI1 knockdown plasmid into the brain at E13.5. The quantification of the percentage of GFP and TUJ1 double-positive cells relative to the total GFP-positive cells is shown as a bar graph (n=3 independent experiments; *P<0.05; bars represent mean±S.E.M). The scale bar represents 50 μm. (j) Model of how H3.3 regulates the level of H4K16ac and GLI1 expression

