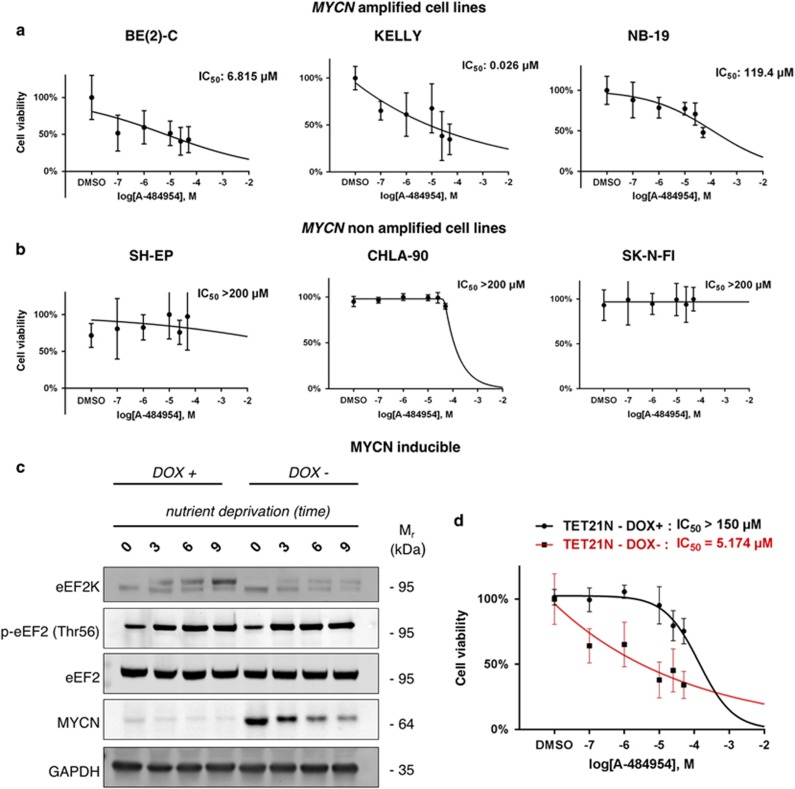
Figure 4.
A-484954 impairs MYCN overexpressing NB cell line survival under ND. (a,b) Dose-response curve for the MYCN amplified (a) and MYCN non-amplified cell lines (b) after 48 h of ND and different concentrations of A-484954 or equal dose of DMSO. Cell viability values are normalized for the DMSO (control) average cell viability value at the specific time-point. Each MTT assay is carried out in eight replicates. (c) Western blot analysis on the Tet21N cell line under ND at different time-points. GAPDH is used to verify equal samples loading. (d) Dose-response curve for the Tet21N cell line after 48 h of ND and different concentrations of A-484954 or equal dose of DMSO. Cell viability values are normalized for the DMSO (control) average cell viability value at the specific time-point. Each MTT assay is carried out in eight replicates. The 48 h time point was chosen for the dose-response curves and to calculate the IC50 values based on the results of the time course analysis for all the cell lines, showing the most significant differences in cell viability at this specific time point

