
Figure 2.
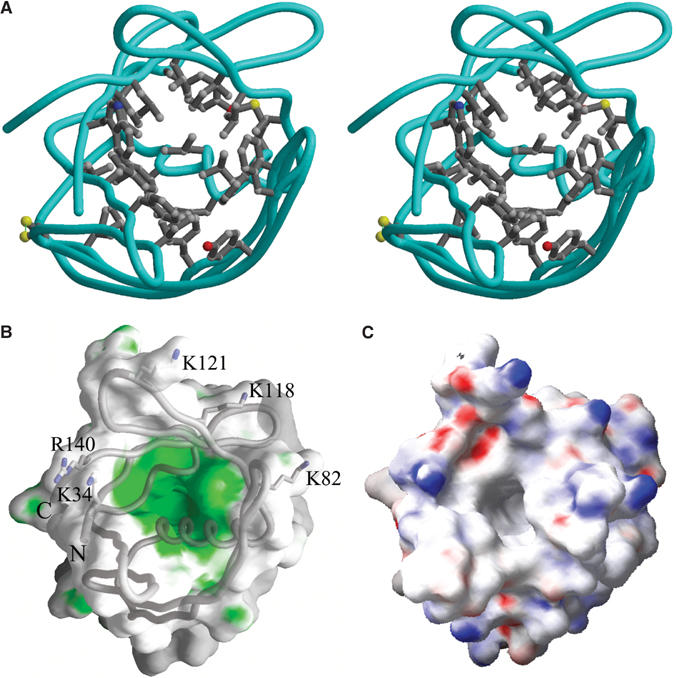
Hydrophobic cavity of MxiM. (A) Stereoscopic representation showing the side chains of the residues that line the hydrophobic cavity. Atoms are colored according to type: carbon atoms are shown in gray, nitrogen atoms are colored blue, oxygen atoms are colored red, and sulfur atoms are colored yellow. The protein backbone trace is represented by the cyan colored worm. (B) GRASP (Nicholls et al, 1991) surface representation of MxiM. Polar and hydrophobic areas are in gray and green, respectively. (C) The electrostatic surface of MxiM is mapped on to the molecular surface as calculated using the program GRASP. The basic residues at the lip of the pore are labeled. Positive and negatively charged areas are blue and red, respectively. All three panels are shown with a similar view.