
Figure 5.
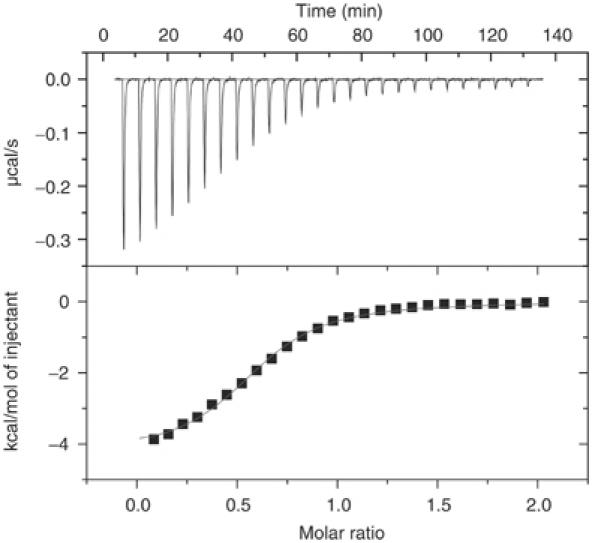
Analysis of the lipid, 1,2-dioctanoyl-sn-gylcero-3-phosphate, binding to MxiM using ITC, at 298 K. (Top) Raw titration data showing the heat response resulting from each 10 μl injection of 0.24 mM lipid into the ITC cell containing 24.6 μM MxiM in 20 mM HEPES at pH 7.5. (Bottom) Peak area normalized to the moles of lipid added and corrected for the heat of dilution (squares), and nonlinear least squares fit (line) to a single-site bimolecular interaction model.