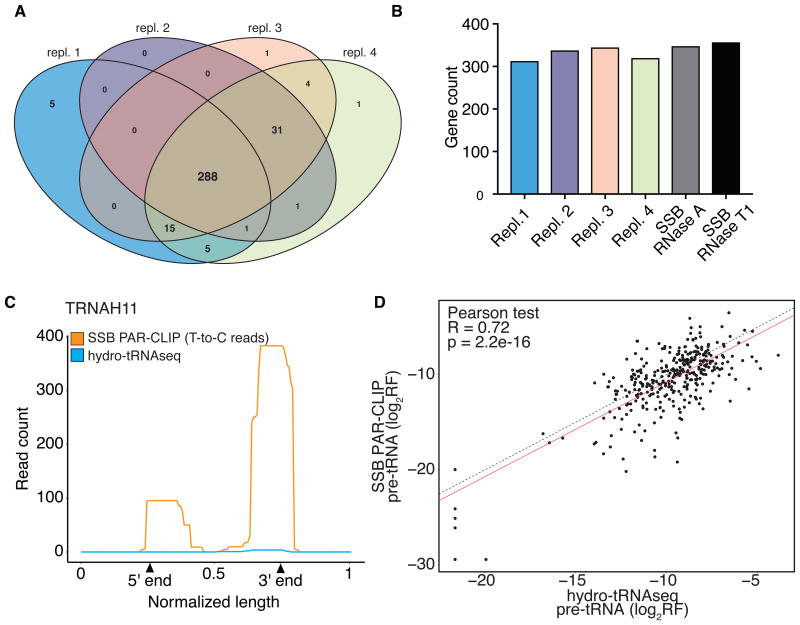
Figure 3. tRNA gene annotation.
(A) Venn diagram of expressed tRNA genes detected by hydro-tRNAseq in HEK293 cells. Genes with read evidence in both the 5′ leader and 3′ trailer of the pre-tRNA were counted. (B) Bar chart showing the number of pre-tRNAs detected in each replicate of hydro-tRNAseq and SSB PAR-CLIP. (C) Example of one out of seven pre-tRNAs that were detected by SSB PAR-CLIP, but were not detected in any of four hydro-tRNAseq replicates. (D) Correlation of relative read frequencies (log2-transformed) of precursor tRNAs between hydro-tRNAseq (x-axis) and SSB PAR-CLIP (y-axis). Correlation was calculated using the Pearson test. Linear fit is shown in red. The y=x line (dotted) is shown for comparison. See also Fig. S4, S5 and S6, and Table S2, S3 and S4.

