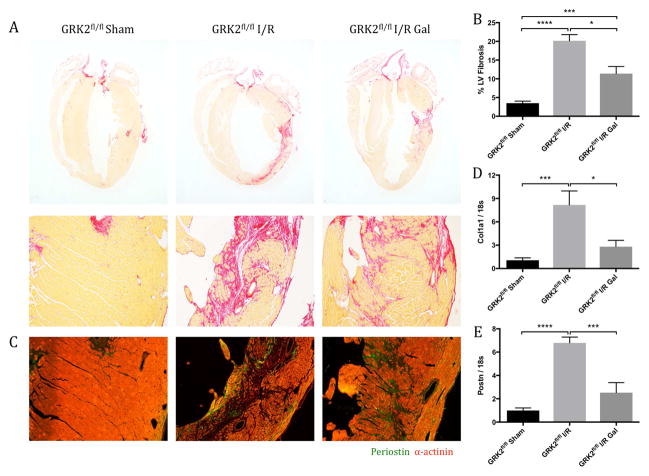
Figure 2. Fibrotic Scar Formation and Marker Expression.
The effect of Gβγ-GRK2 inhibition on fibrotic scar formation (A) was assessed by picrosirius red staining, and (B) quantification was expressed as percentage of collagen deposition over total LV area. (C) Representative images show periostin expression within the ventricular free wall. Messenger ribonucleic acid levels of fibrosis markers (D) Col1a1 and (E) Postn were measured by qPCR and normalized to 18s ribosomal sub-unit. *p < 0.05; **p < 0.01; ***p < 0.001; ****p < 0.0001. Abbreviations as in Figure 1.

