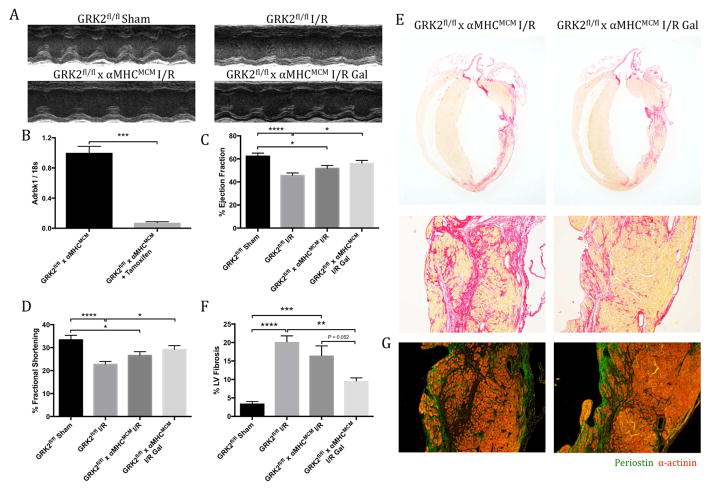
Figure 3. Cardiac Function and Fibrosis in Cardiomyocyte-specific GRK2 Knockout Mice Post-I/R.
(A) Representative m-mode echocardiographic images showing ventricular contractility. (B) GRK2 transcript expression in cardiomyocytes isolated from GRK2fl/fl x α-MHCMCM mice by qPCR analysis. Function quantified by (C) percent ejection fraction and (D) fractional shortening. Collagen deposition assessed by (E) picrosirius red staining, with the fibrotic area quantified as percentage of collagen deposition over total left ventricular area (F). (G) Representative images of periostin (Postn) expression within the ventricular free wall 4 weeks post-I/R. *p < 0.05; **p < 0.01; ***p < 0.001; ****p < 0.0001. α-MHC = α-myosin heavy chain; other abbreviations as in Figure 1.

